


A small idea using Figma AI, Supabase, and a product-first mindset.
“Who Really Wins at Catan?”
1. Context & Role
Project: Web-based Settlers of Catan scoreboard
Timeline: 3 weeks
Team: Just me
My role: Product design, UI, prototyping, data modeling, and implementation using Figma AI and Supabase
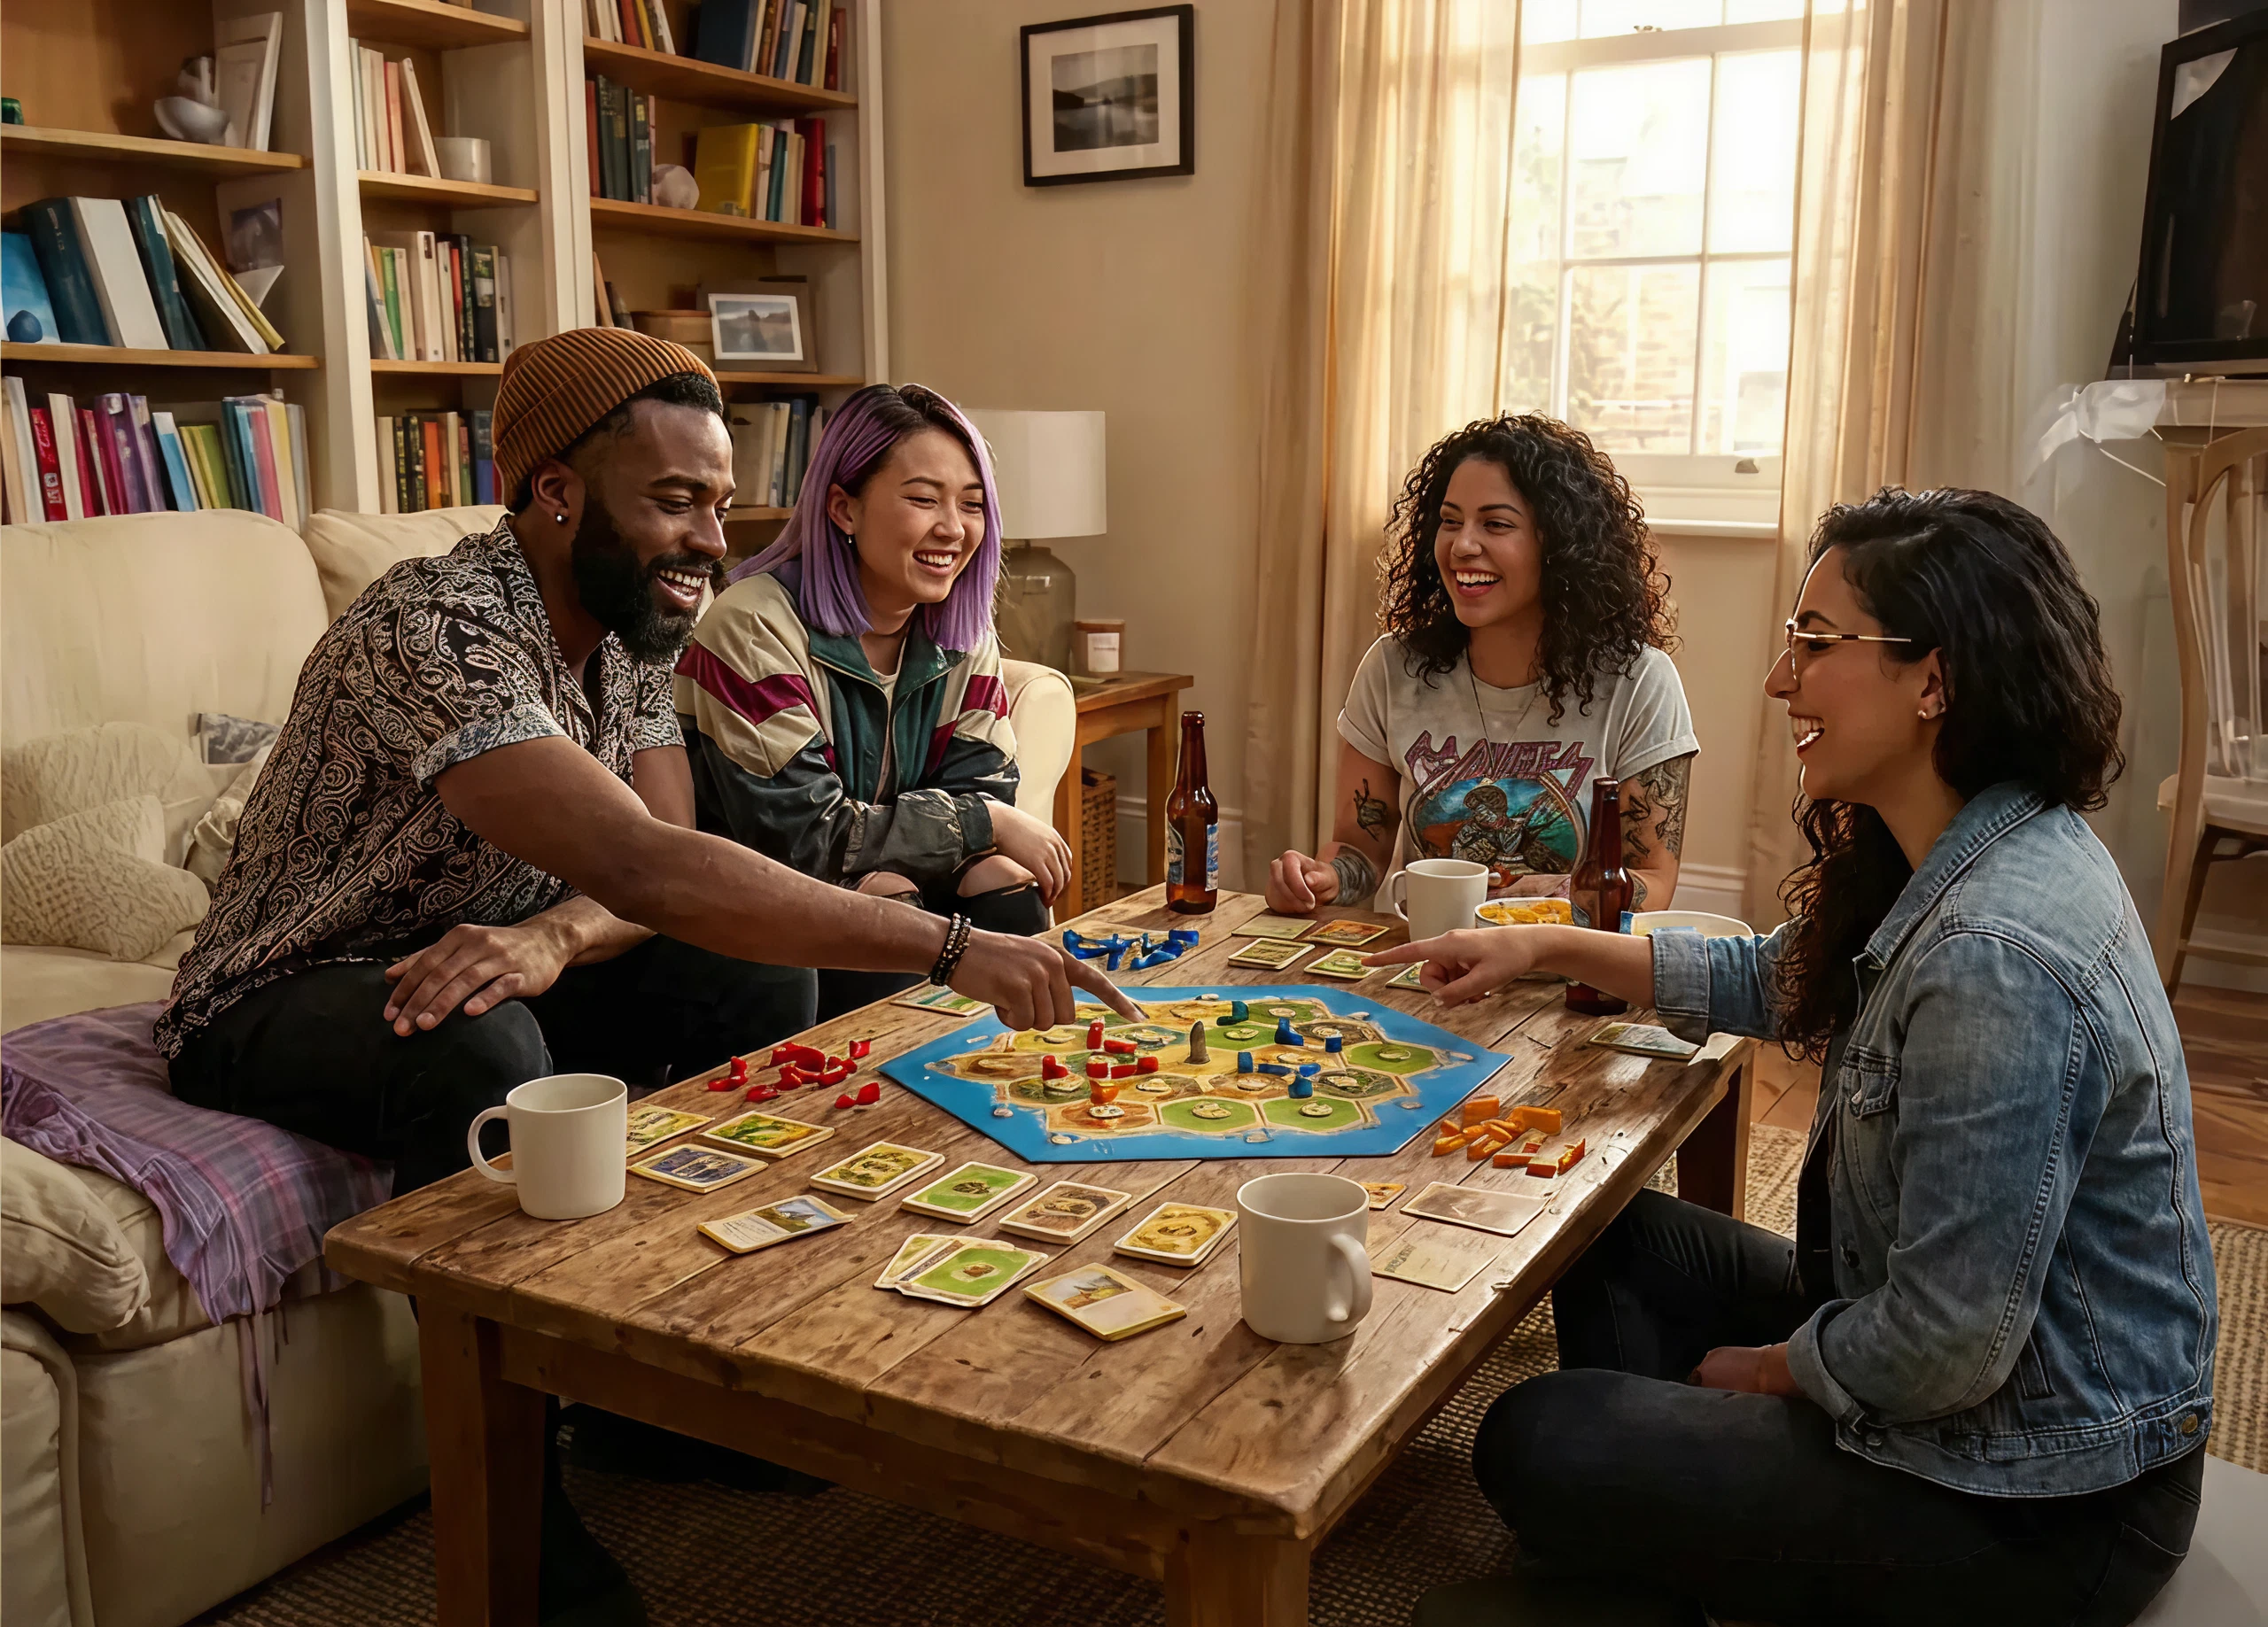
This project started as a small, personal frustration. My friends and I regularly play Settlers of Catan, and after a few game nights we always ended up debating the same thing:
“Who actually wins the most?”
Everyone had a different memory of past games, and it was all very subjective. I decided to turn that recurring argument into a small product.
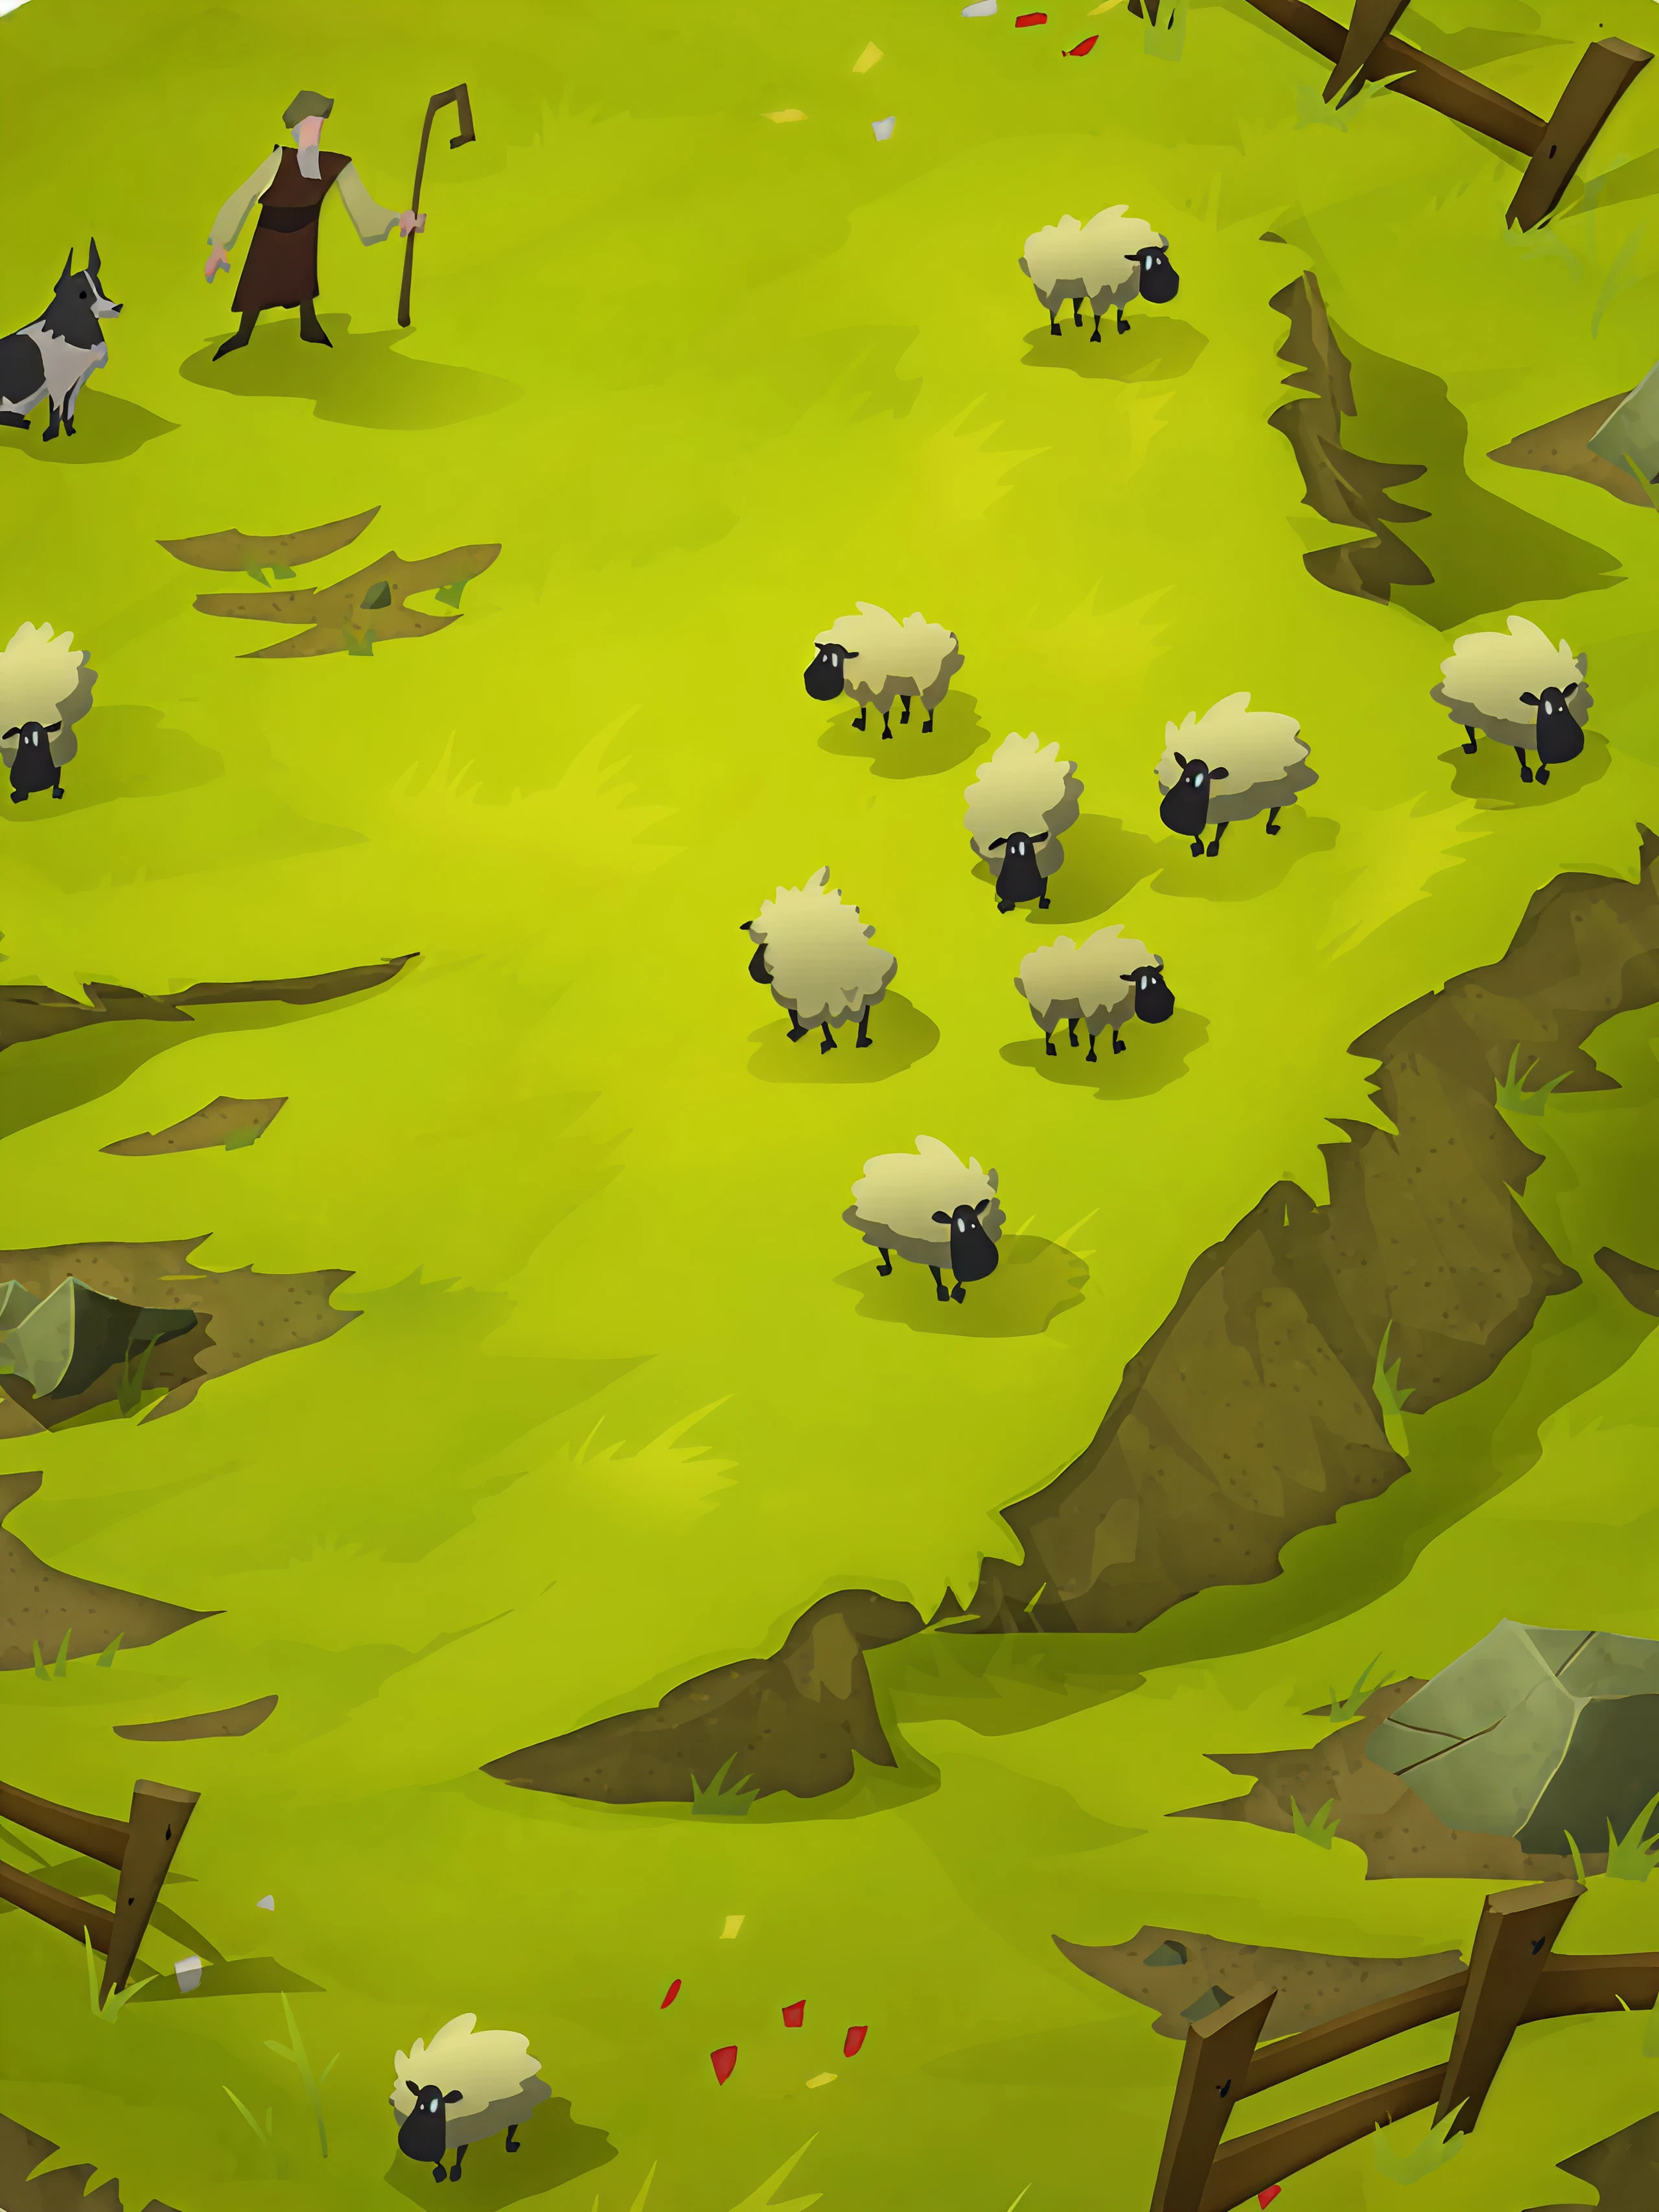
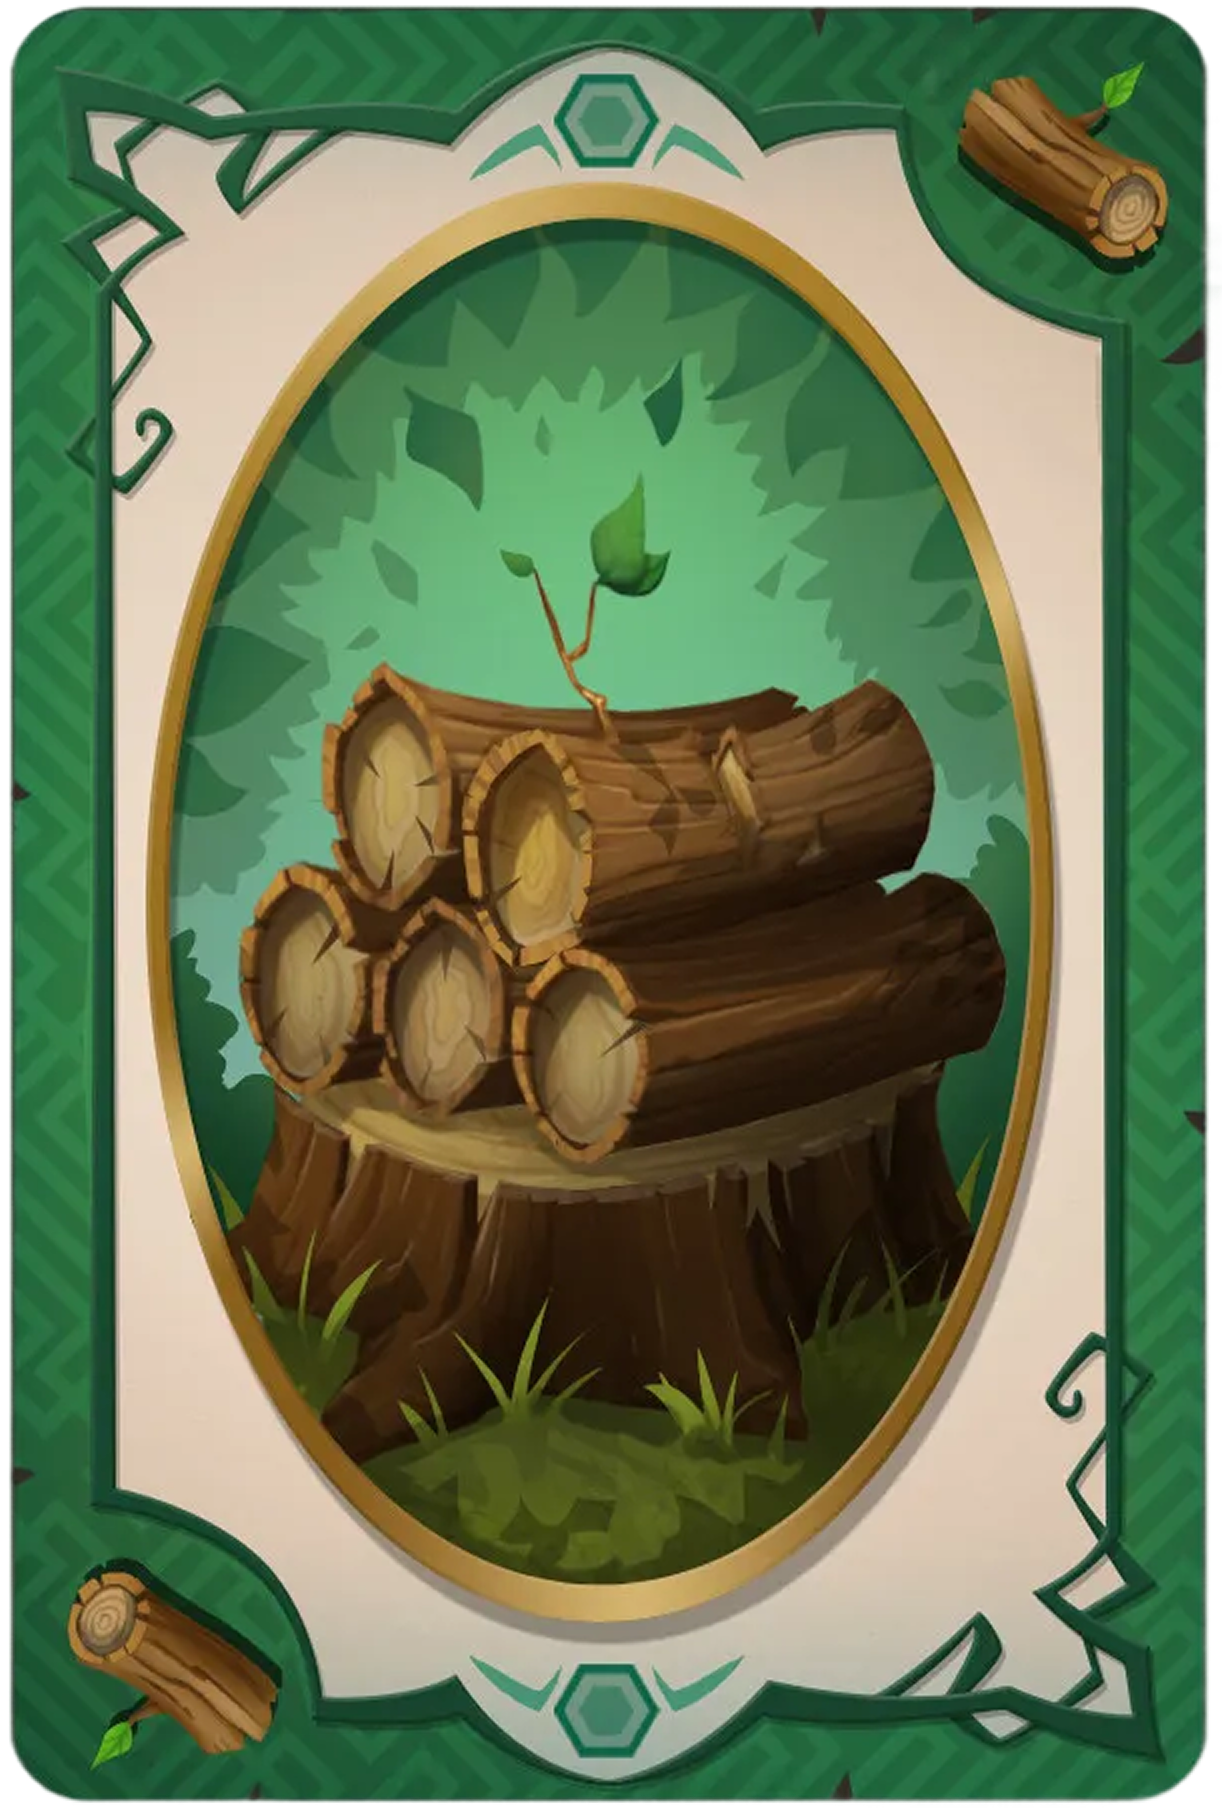
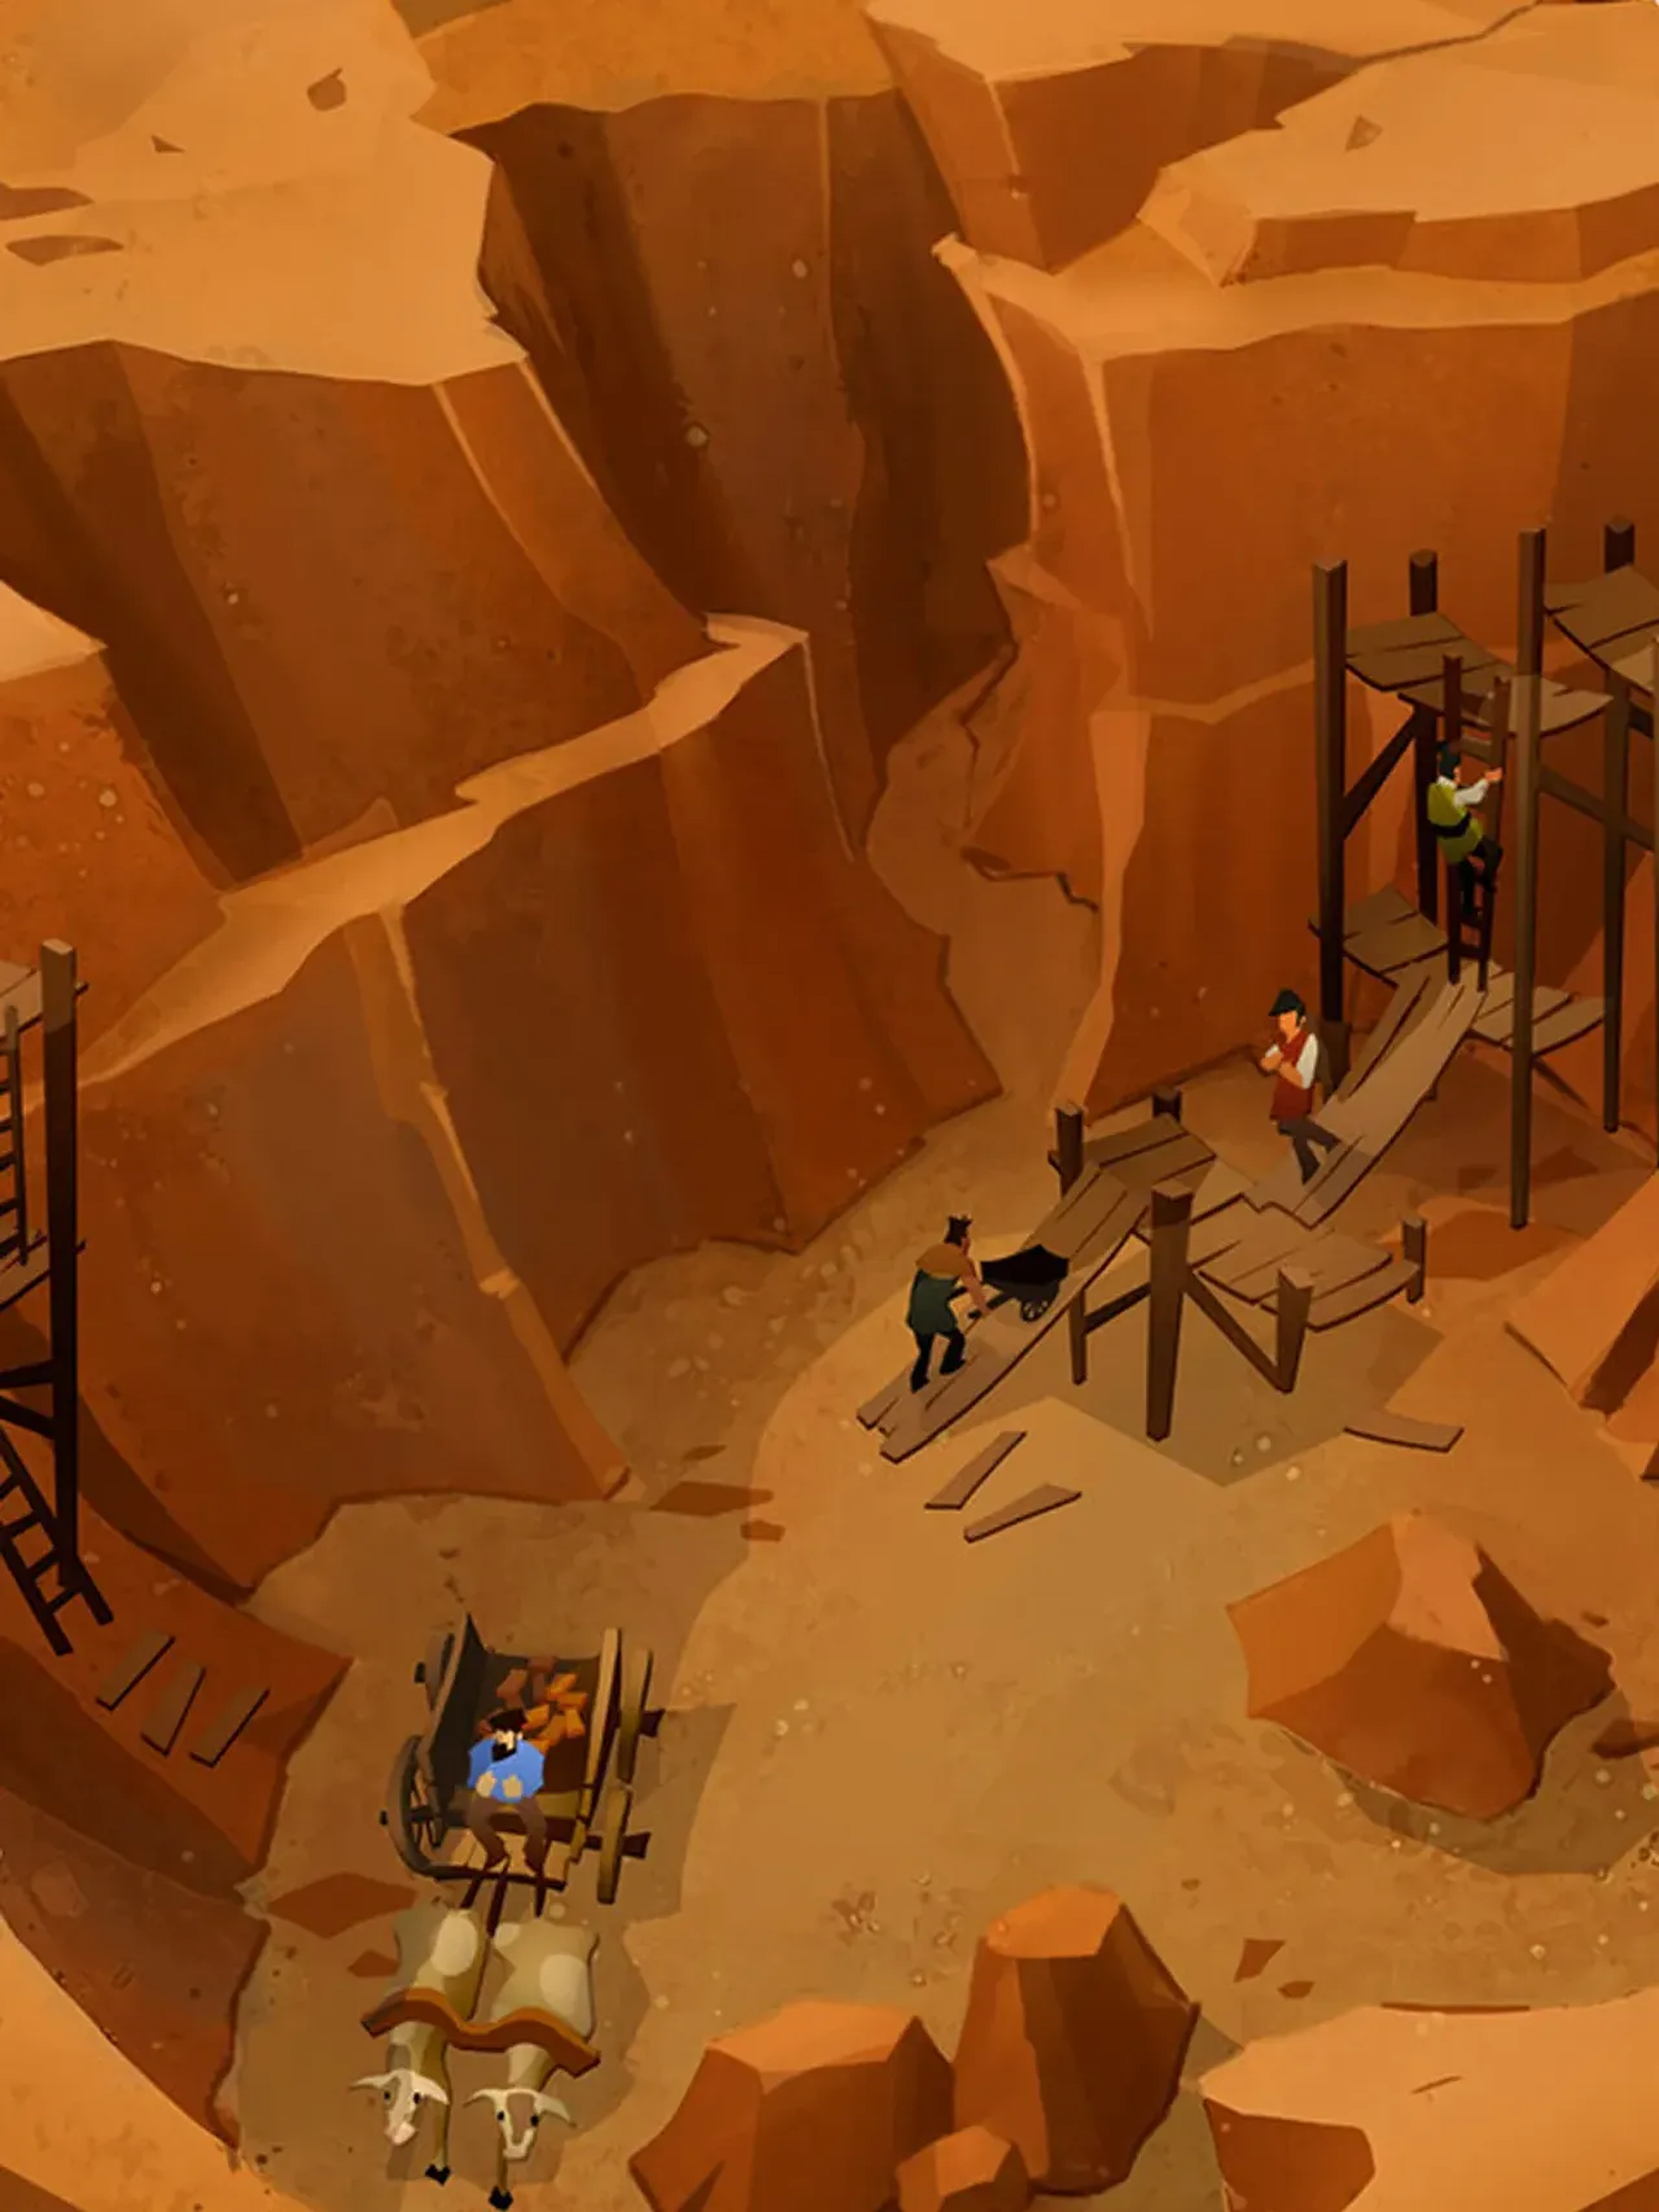
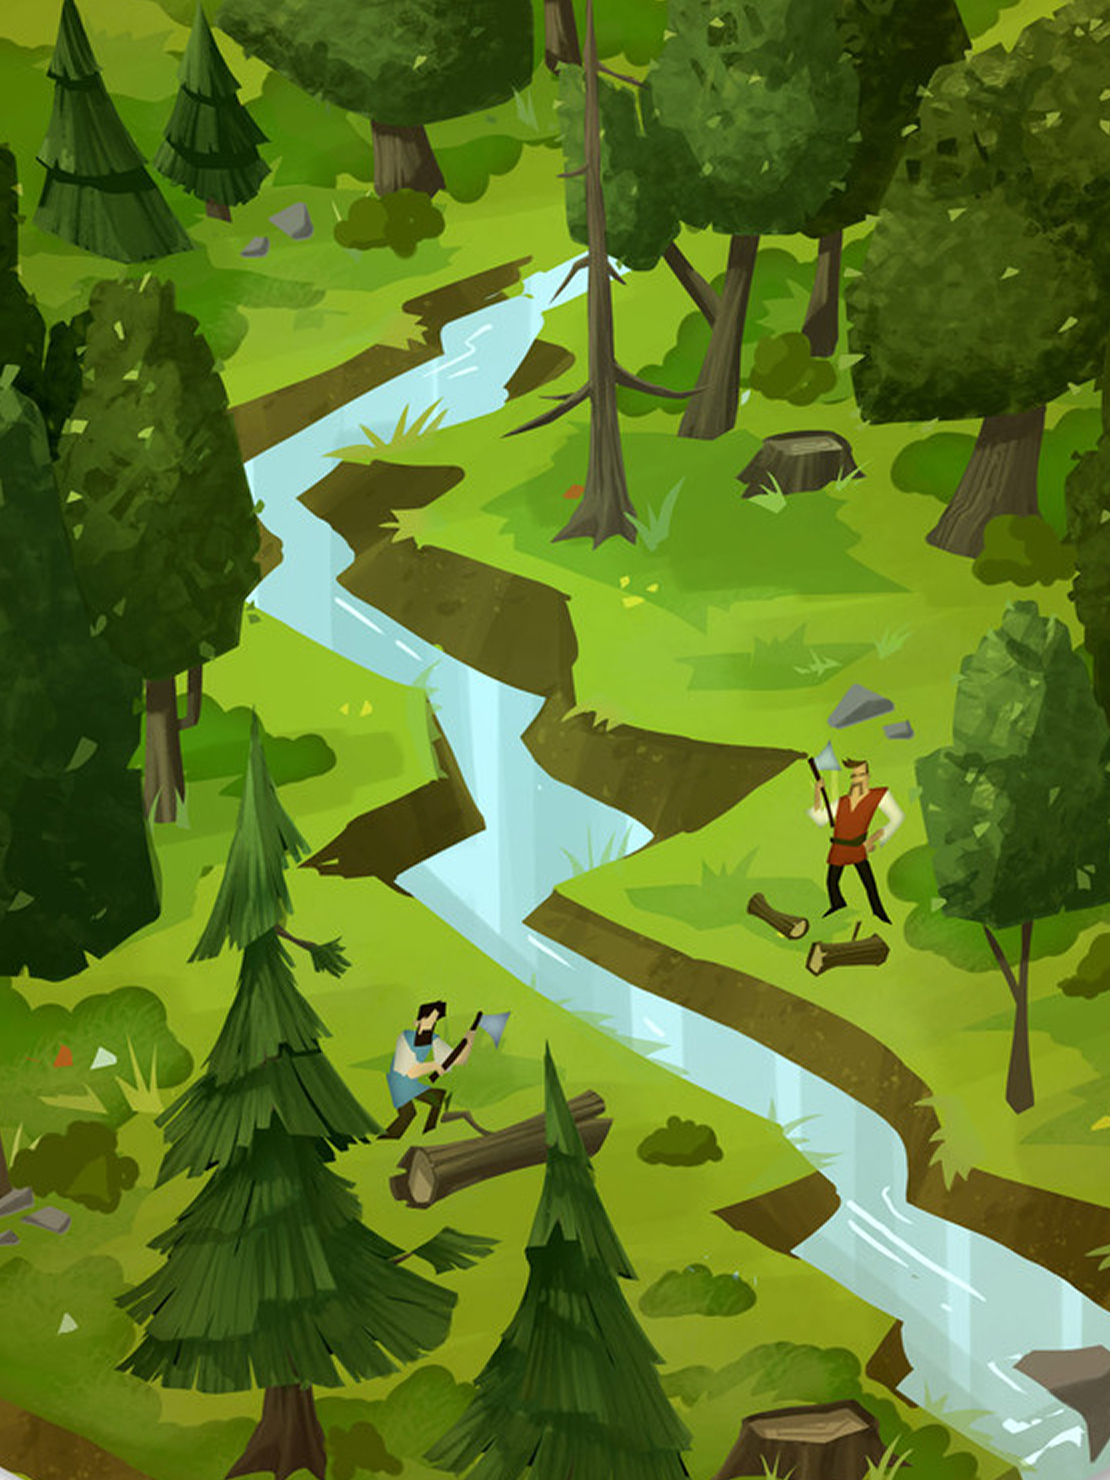
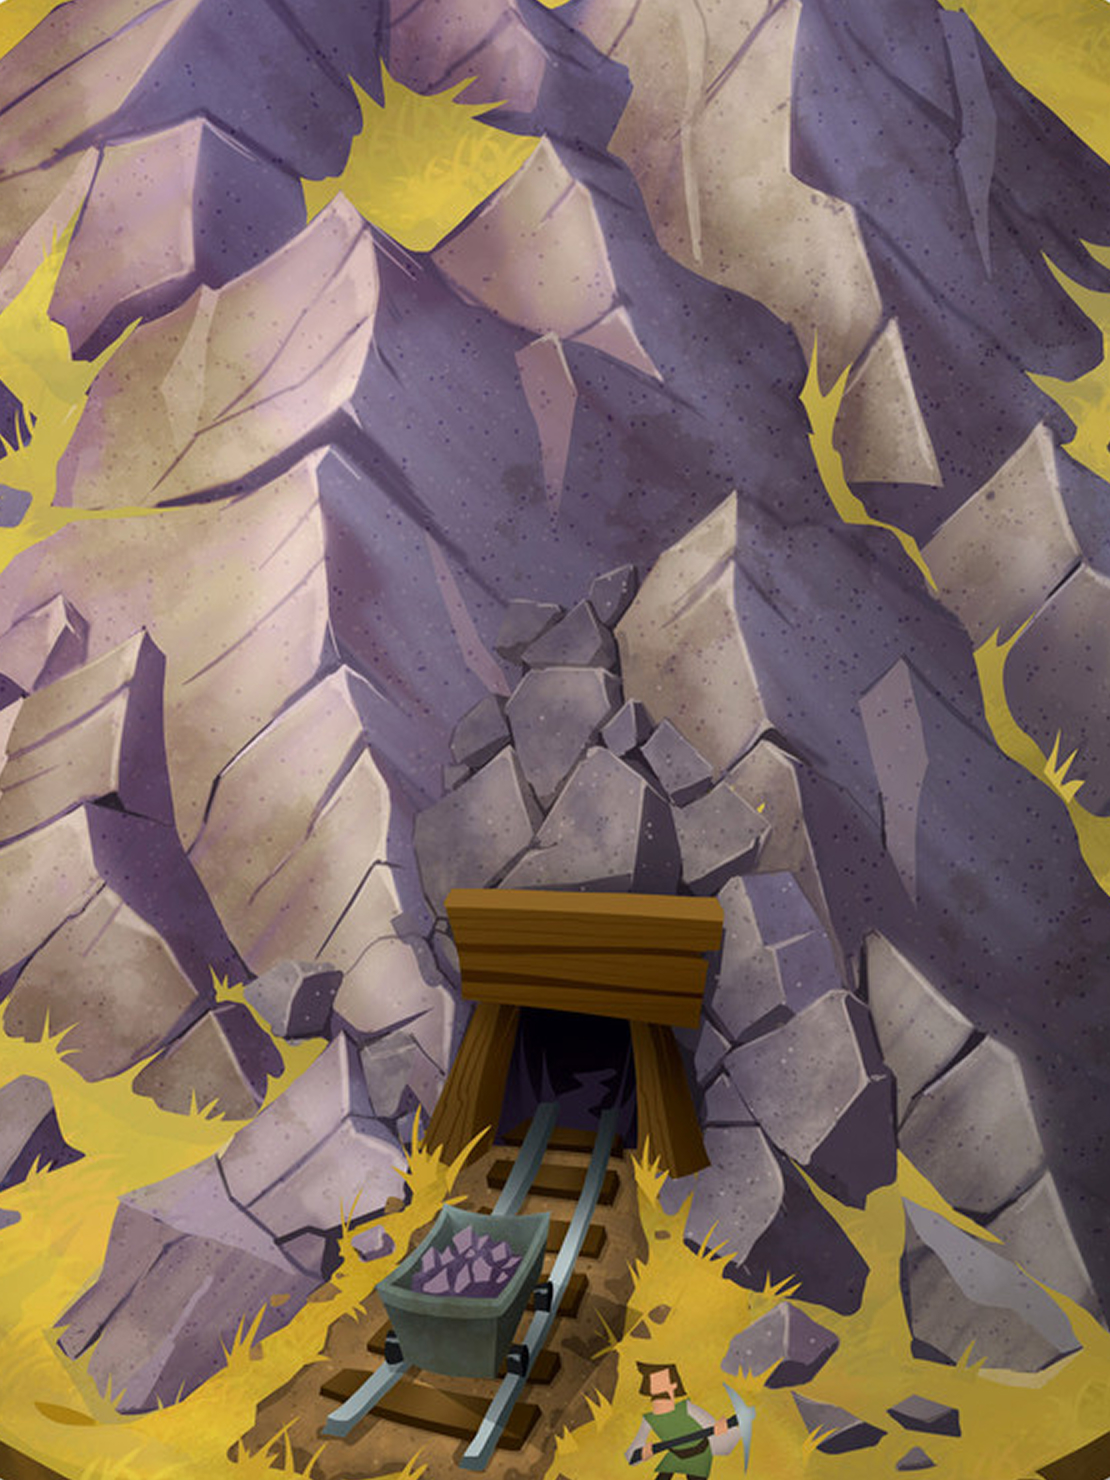
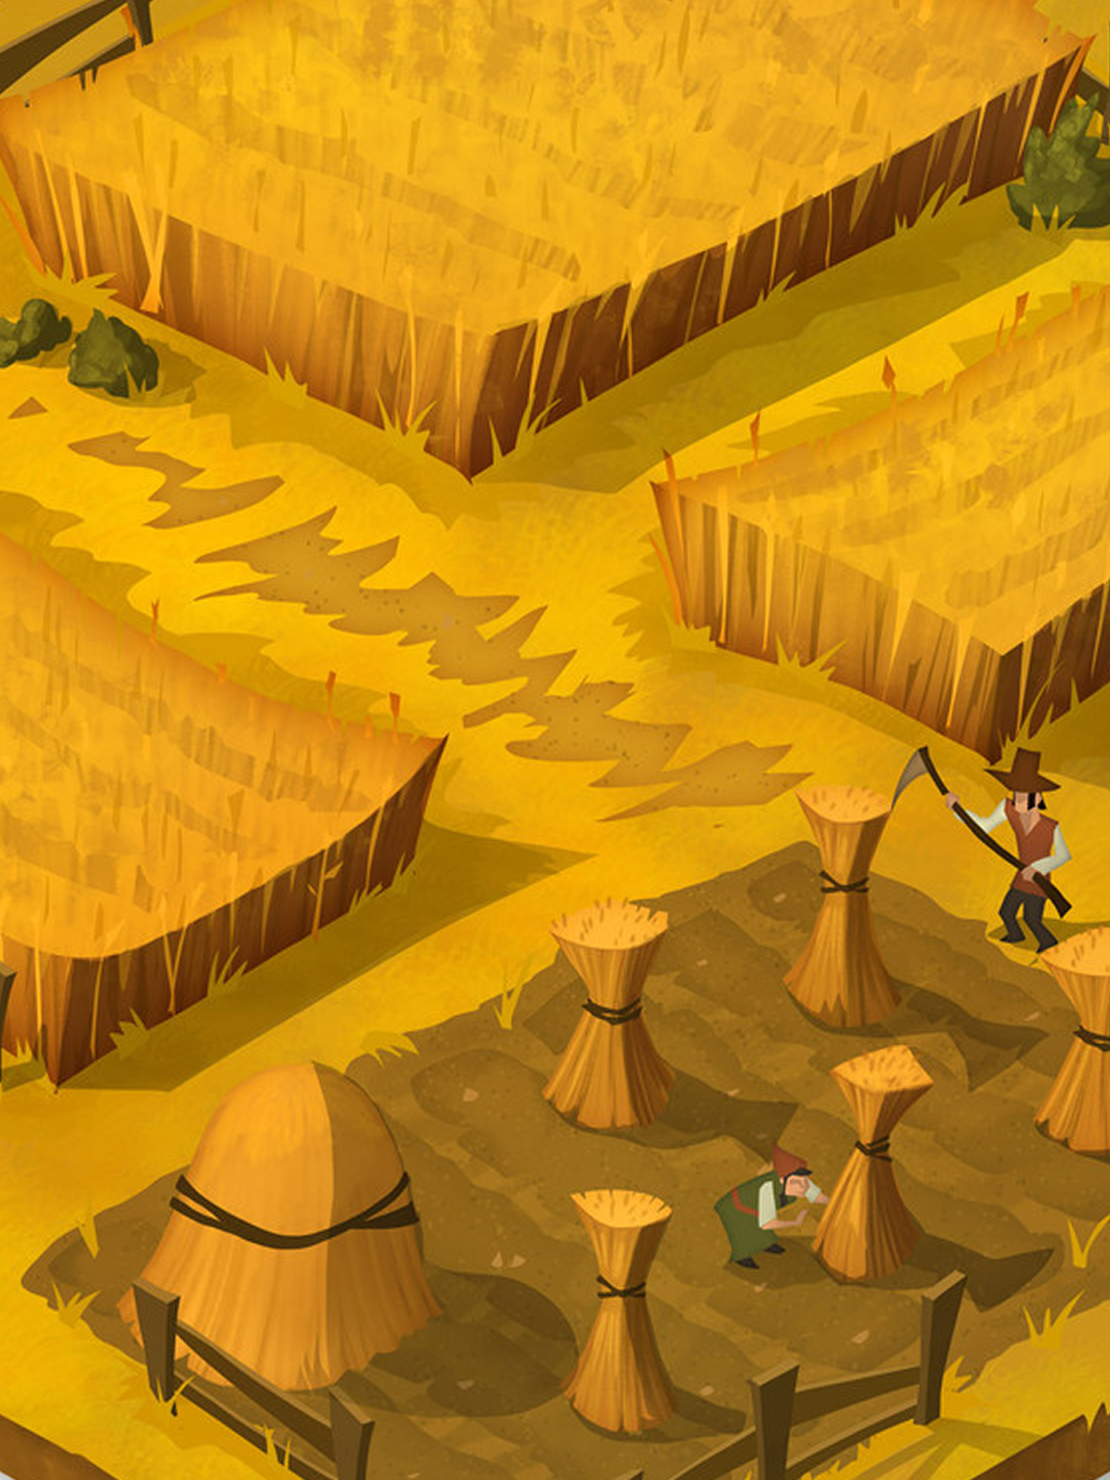
Artwork credit: Matt Mocarski
2. The Problem
We had no shared record of our games.
Every session ended with:
- Someone claiming they were “basically undefeated”
- Someone else insisting they always lost
- No one having proof
The real issue wasn’t competition, it was that memories are
unreliable, and over time the fun trash-talk
became mildly annoying.
I wanted a simple way to:
- Track games and players
- See who won over time
- Make the arguments playful instead of endless
3. Why I Built This
We had no shared record of our games.
Every session ended with:
- Someone claiming they were “basically undefeated”
- Someone else insisting they always lost
- No one having proof
The real issue wasn’t competition — it was that memories are unreliable, and over time the fun trash-talk became mildly annoying.
I wanted a simple way to:
- Track games and players
- See who won over time
- Make the arguments playful instead of endless
4. Research & Inputs
We had no shared record of our games.
Every session ended with:
- Someone claiming they were “basically undefeated”
- Someone else insisting they always lost
- No one having proof
The real issue wasn’t competition — it was that memories are unreliable, and over time the fun trash-talk became mildly annoying.
I wanted a simple way to:
- Track games and players
- See who won over time
- Make the arguments playful instead of endless
5. Problem Definition & Goals
Problem Statement
How might we create a simple, shared way to track Catan games so that wins, losses, and bragging rights are based on data instead of memory?
Design Goals
- Make game logging take under 30 seconds
- Make results easy to read at a glance
- Keep the tone playful, not competitive
- Work on mobile during game night
Success Indicators
- Friends actually use it after games
- Fewer arguments about who wins
- People start referencing the site jokingly

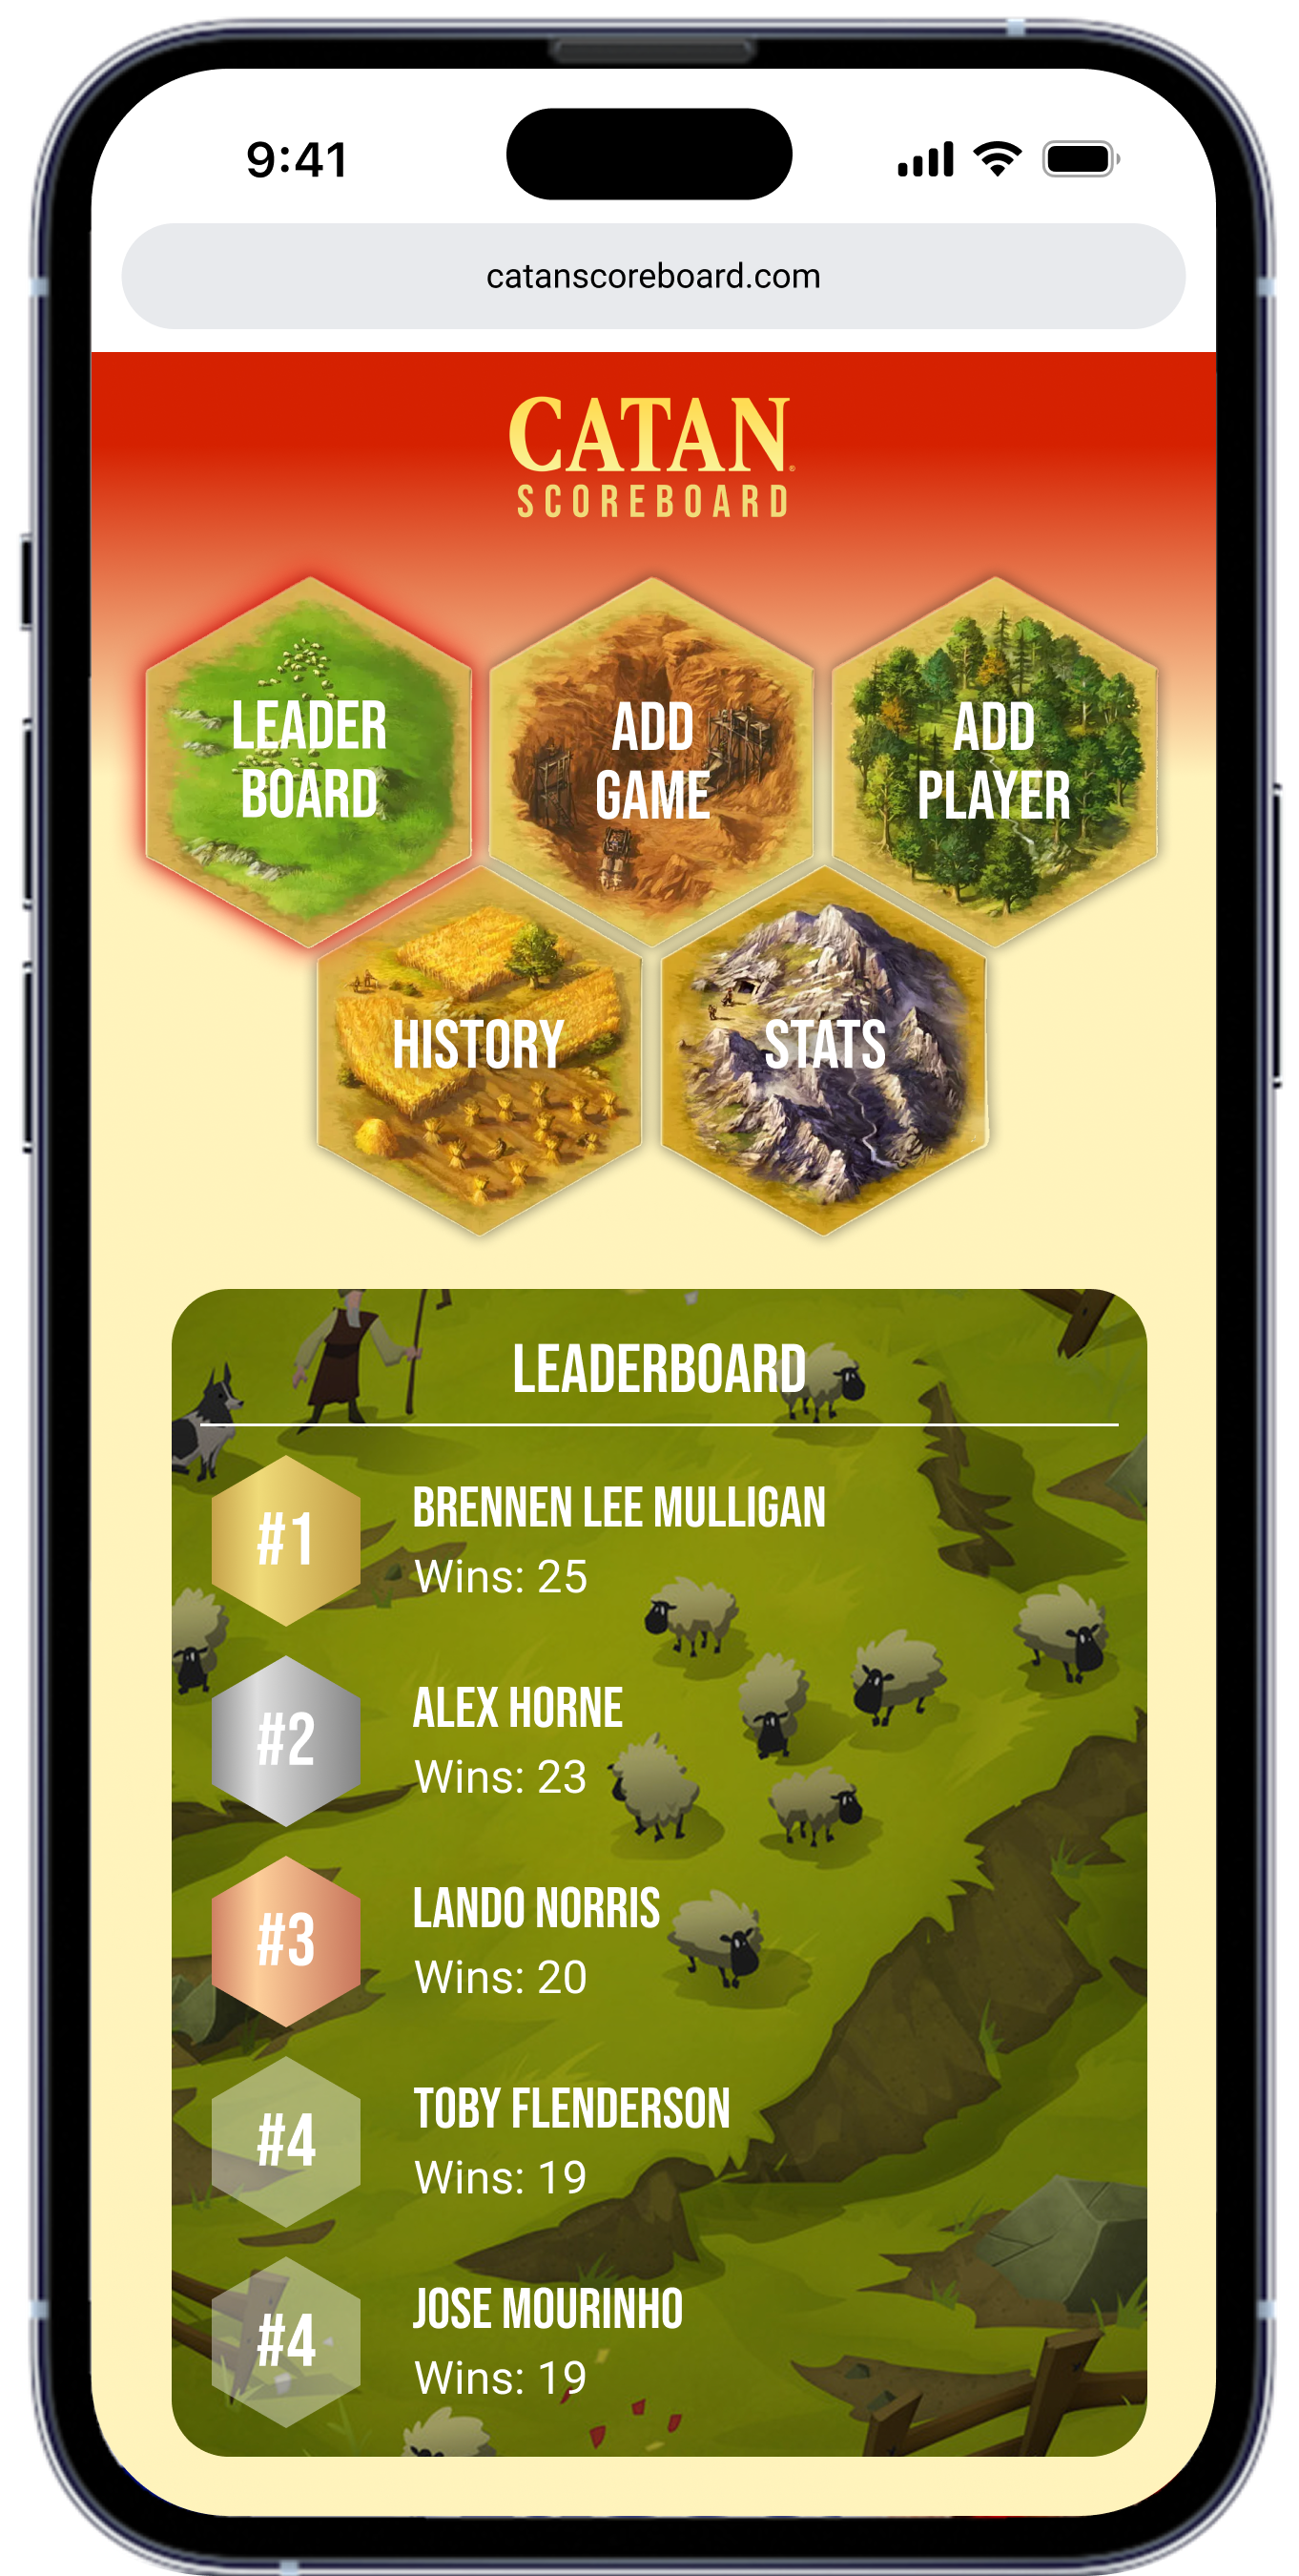
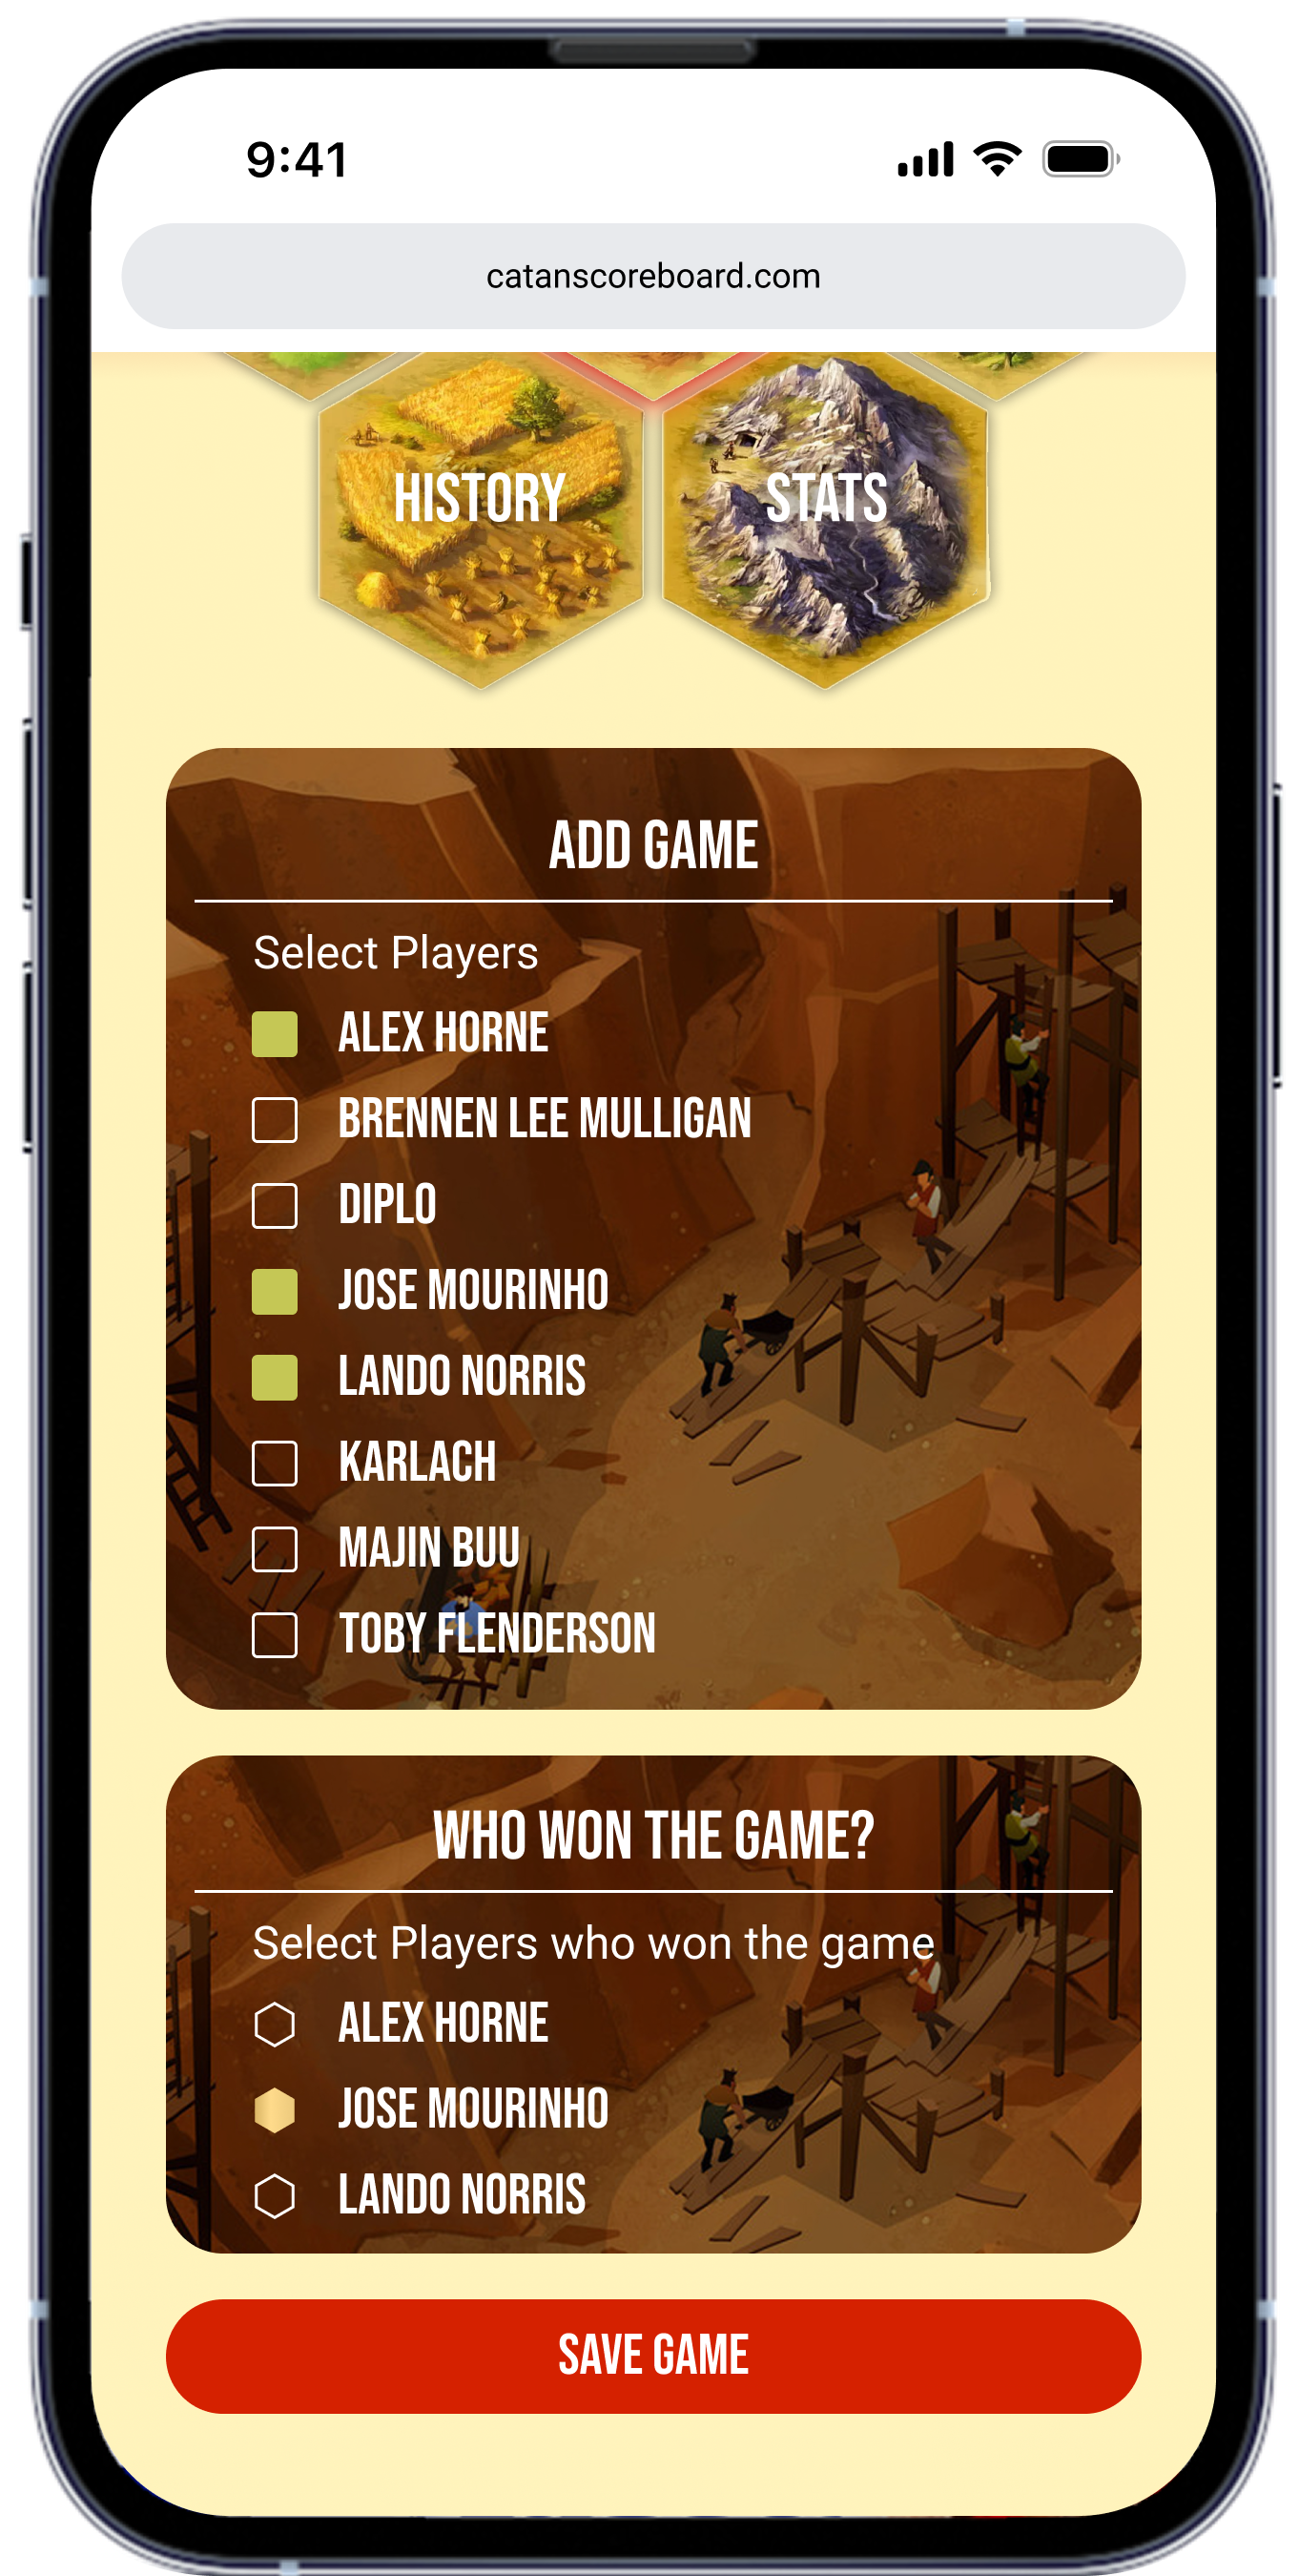
6. Solution
I built a small website where anyone in the group could:
- Add a new game
- Select the players
- Enter final scores
- Instantly see updated stats
Behind the scenes:
- Figma’s AI tools helped me prototype UI quickly
- Supabase handled players, games, and scores
- The site updated in real time
The focus was not perfection — it was getting something usable into our hands.
7. Key Design Decisions
What I intentionally kept simple
- No logins
- No profiles
- No historical editing
Just:
- Players
- Games
- Scores
- Stats
Why
Every extra feature would reduce the chance someone would actually use it on game night.
This was a scoreboard, not a social network.

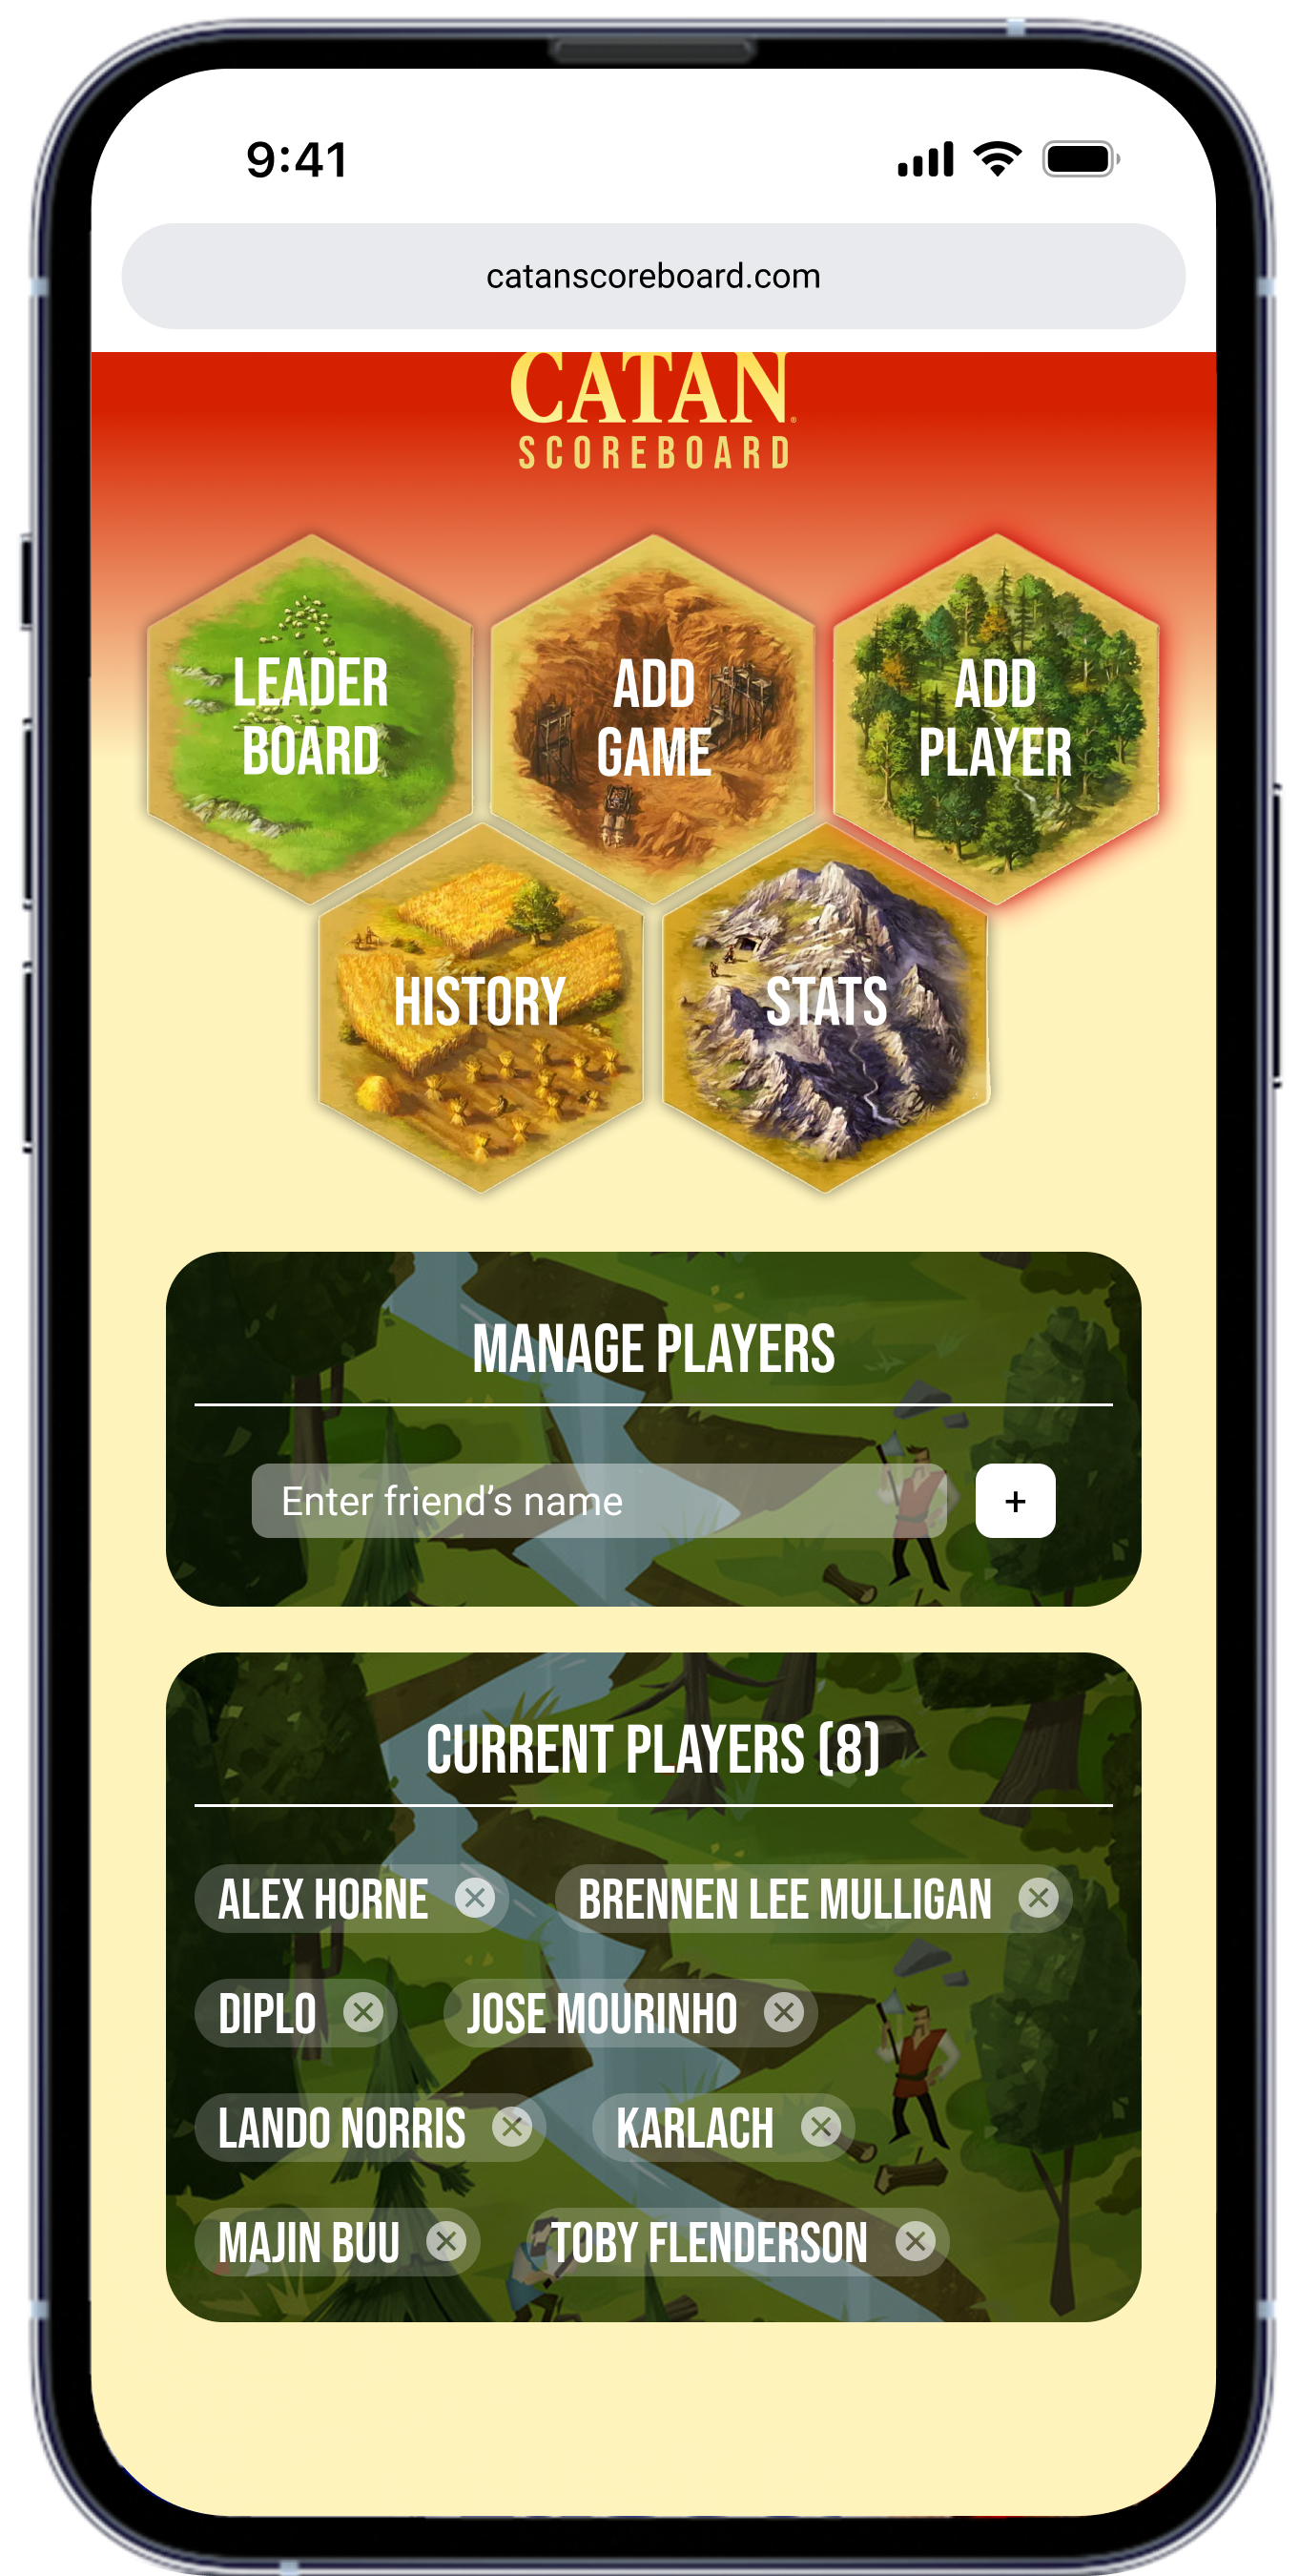
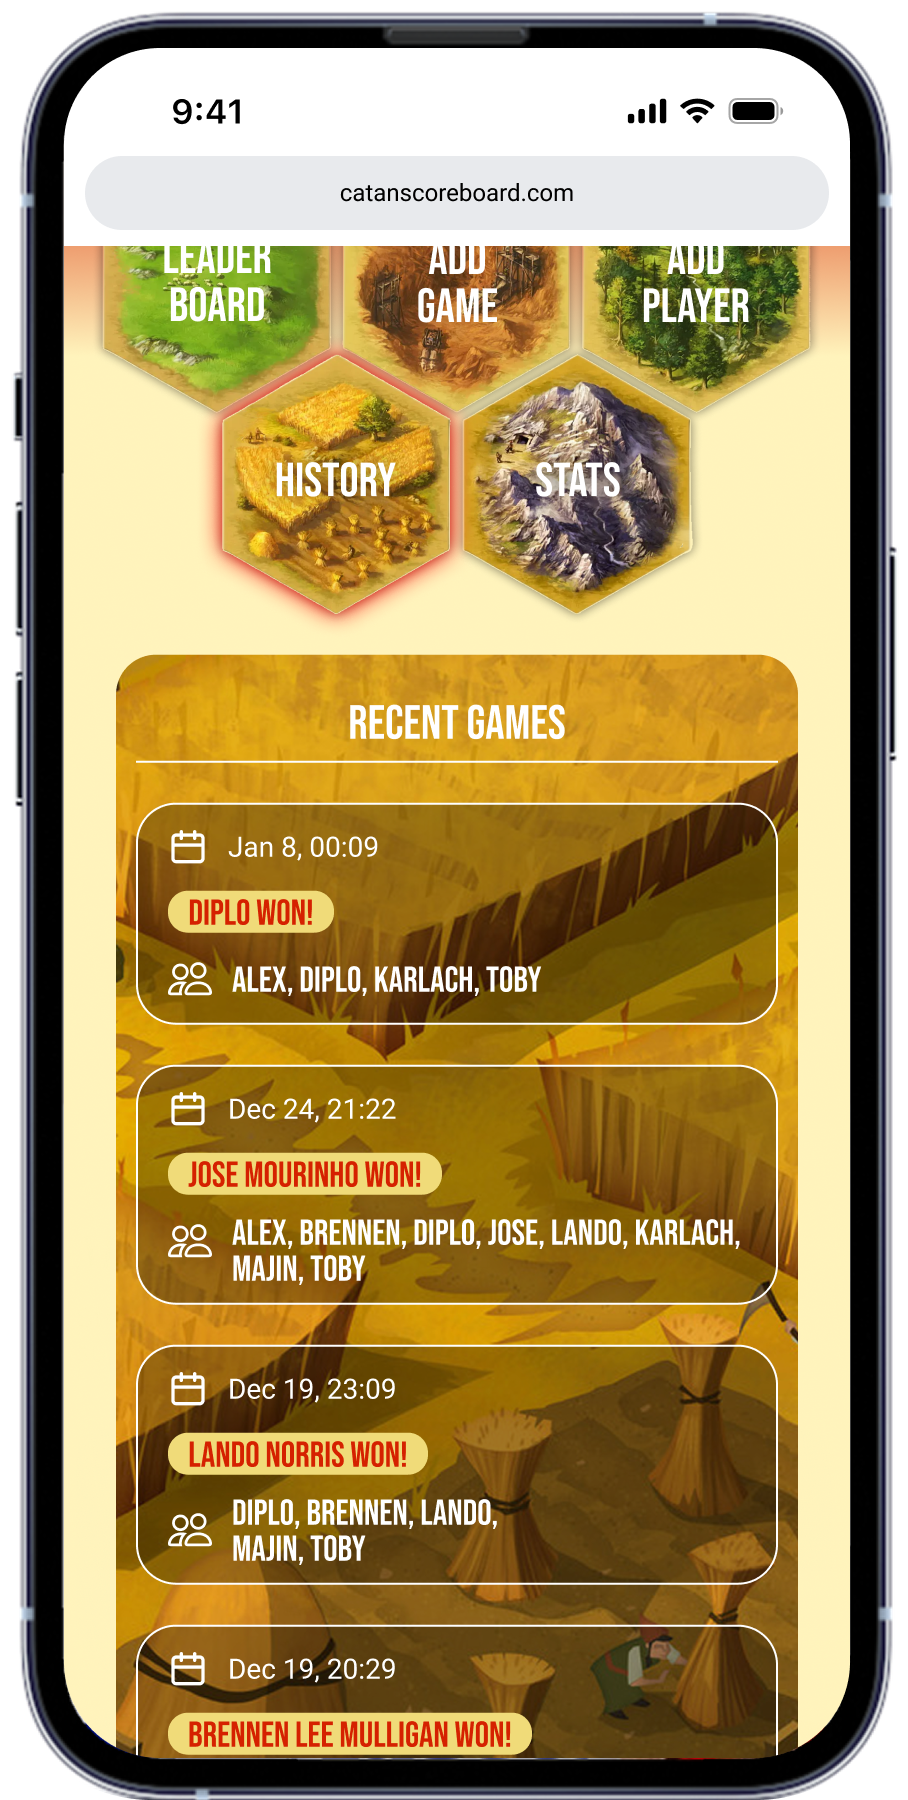
8. Final Experience
The site had five core screens (in accordance with the five core resources of the game):
- Add GameSelect players, enter scores, submit.
- LeaderboardSee total wins, average score, and games played.
- HistoryA simple list of past games with dates and winners.
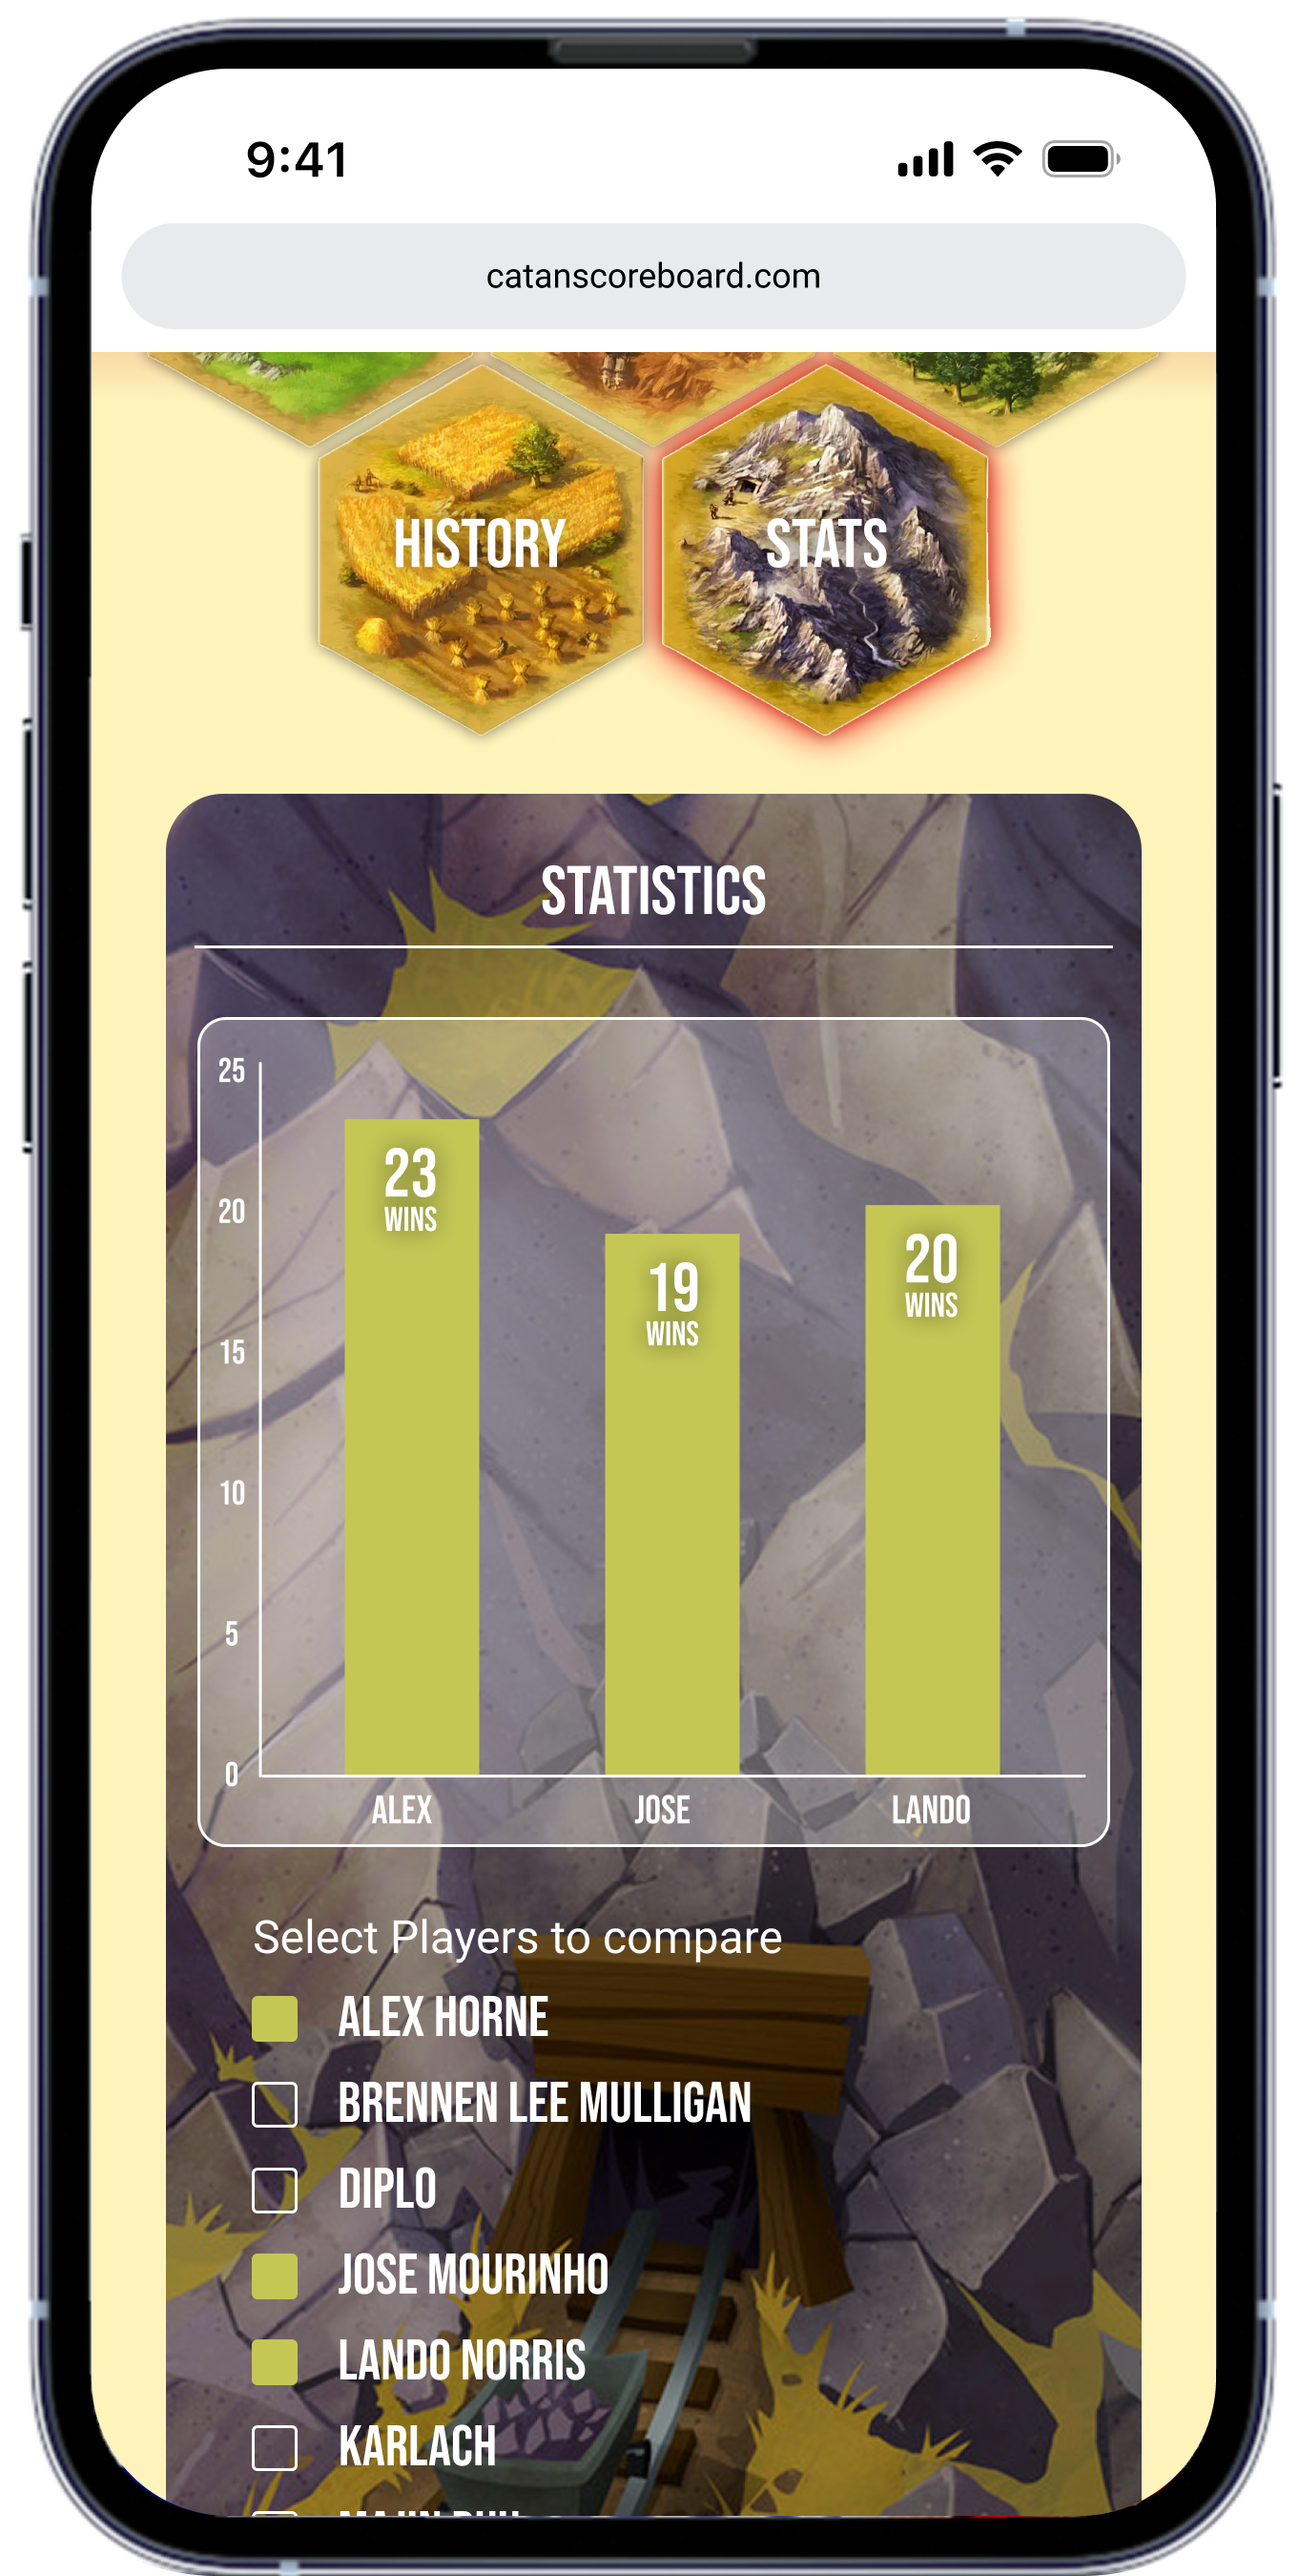
- StatisticsTo compare the results of different combination of players.
- Manage PlayersAdd to new players or edit the existing player list.
Everything was designed for quick glances and fast input on a phone.
9. Using Figma Make and Supabase
This project was also an experiment in vibe coding and AI-assisted building.
I used:
- Figma and Figma Make to generate and iterate on layouts
- Supabase to set up tables and relationships
- Simple front-end logic to connect the two
As a product designer, this helped me:
- Test ideas without waiting on engineering
- Explore data models firsthand
- Understand how design decisions affect what gets built
10. Outcomes
After a few weeks of using it:
- We logged 42 games
- 9 regular players used the scoreboard
- The “who wins the most?” argument basically disappeared
Instead, people started saying things like:
- “The data doesn’t lie.”
- “I’m coming for first place.”
- “Wow, I’m worse than I thought.”
Which was exactly the kind of fun I was aiming for.
11. Reflection
This project reminded me that good product ideas often come from small, real frustrations.
I didn’t set out to build a business.
I set out to stop an annoying argument and see what would happen if I followed that curiosity all the way to a working product.
I learned that:
- Even tiny problems are worth solving if they happen often
- Tools like Figma AI and Supabase let designers move much faster
- Making something real, even if it’s small, teaches more than polishing concepts
If I continued this, I’d explore:
- Player profiles
- Game types or expansions
- Lighthearted achievements
But even in its simple form, the scoreboard already did its job:
it turned an ongoing debate into a shared, fun piece of data.


A small idea using Figma AI, Supabase, and a product-first mindset.
“Who Really Wins at Catan?”
1. Context & Role
Project: Web-based Settlers of Catan scoreboard
Timeline: 3 weeks
Team: Just me
My role: Product design, UI, prototyping, data modeling, and implementation using Figma AI and Supabase
This project started as a small, personal frustration. My friends and I regularly play Settlers of Catan, and after a few game nights we always ended up debating the same thing:
“Who actually wins the most?”
Everyone had a different memory of past games, and it was all very subjective. I decided to turn that recurring argument into a small product.
Artwork credit: Matt Mocarski
2. The Problem
We had no shared record of our games.
Every session ended with:
- Someone claiming they were “basically undefeated”
- Someone else insisting they always lost
- No one having proof
The real issue wasn’t competition, it was that memories are
unreliable, and over time the fun trash-talk
became mildly annoying.
I wanted a simple way to:
- Track games and players
- See who won over time
- Make the arguments playful instead of endless
3. Why I Built This
This wasn’t about building a startup. It was about:
- Solving a real, recurring problem in my friend group
- Experimenting with AI-assisted workflows
- Seeing how far I could take an idea from “annoyance” to “working product”
Signals
After about 10 game nights:
- Everyone had a different “top winner”
- Nobody remembered scores accurately
- We kept joking about needing a scoreboard
That was enough validation.
4. Research & Inputs
Because this was a personal project, research was informal but still intentional.
What I looked at
- How we actually play Catan
- What people cared about after games
- How much friction people would tolerate
Key Insights
Insight 1
People didn’t want complexity. They just wanted to know who won.
Insight 2
Anything that took more than a few seconds to log wouldn’t be used.
Insight 3
The fun came from seeing patterns over time, not individual games.
This meant the product needed to be extremely lightweight and focused on a few core stats.
5. Problem Definition & Goals
Problem Statement
How might we create a simple, shared way to track Catan games so that wins, losses, and bragging rights are based on data instead of memory?
Design Goals
- Make game logging take under 30 seconds
- Make results easy to read at a glance
- Keep the tone playful, not competitive
- Work on mobile during game night
Success Indicators
- Friends actually use it after games
- Fewer arguments about who wins
- People start referencing the site jokingly
6. Solution
I built a small website where anyone in the group could:
- Add a new game
- Select the players
- Enter final scores
- Instantly see updated stats
Behind the scenes:
- Figma’s AI tools helped me prototype UI quickly
- Supabase handled players, games, and scores
- The site updated in real time
The focus was not perfection — it was getting something usable into our hands.
7. Key Design Decisions
What I intentionally kept simple
- No logins
- No profiles
- No historical editing
Just:
- Players
- Games
- Scores
- Stats
Why
Every extra feature would reduce the chance someone would actually use it on game night.
This was a scoreboard, not a social network.
8. Final Experience
The site had five core screens (in accordance with the five core resources of the game):
- Add GameSelect players, enter scores, submit.
- LeaderboardSee total wins, average score, and games played.
- HistoryA simple list of past games with dates and winners.
- StatisticsTo compare the results of different combination of players.
- Manage PlayersAdd to new players or edit the existing player list.
Everything was designed for quick glances and fast input on a phone.
9. Using Figma Make and Supabase
This project was also an experiment in vibe coding and AI-assisted building.
I used:
- Figma and Figma Make to generate and iterate on layouts
- Supabase to set up tables and relationships
- Simple front-end logic to connect the two
As a product designer, this helped me:
- Test ideas without waiting on engineering
- Explore data models firsthand
- Understand how design decisions affect what gets built
10. Outcomes
After a few weeks of using it:
- We logged 42 games
- 9 regular players used the scoreboard
- The “who wins the most?” argument basically disappeared
Instead, people started saying things like:
- “The data doesn’t lie.”
- “I’m coming for first place.”
- “Wow, I’m worse than I thought.”
Which was exactly the kind of fun I was aiming for.
11. Reflection
This project reminded me that good product ideas often come from small, real frustrations.
I didn’t set out to build a business.
I set out to stop an annoying argument and see what would happen if I followed that curiosity all the way to a working product.
I learned that:
- Even tiny problems are worth solving if they happen often
- Tools like Figma AI and Supabase let designers move much faster
- Making something real, even if it’s small, teaches more than polishing concepts
If I continued this, I’d explore:
- Player profiles
- Game types or expansions
- Lighthearted achievements
But even in its simple form, the scoreboard already did its job:
it turned an ongoing debate into a shared, fun piece of data.